
 2 months ago
9339
2 months ago
9339

Spot Solana ETFs have recorded their strongest inflow streak since February as investors position for a potential move toward $120 for SOL.
Spot SOL ETFs captured more than $39 million in net inflows over the last week, a period when futures market activity spiked, revealing that both traditional investors and crypto traders are placing increasing wagers on Solana’s next move higher.
Solana’s native token is up about 15% over the past seven days, trading near $97. The move higher is being reinforced by aligned ETF inflows, increased derivatives positioning, and improving technical momentum—factors that together are restoring bullish sentiment after months of subdued price action.
ETF inflows and futures activity fuel bullish sentiment
ETF inflows are being viewed as a key signal of growing institutional interest in Solana. Analysts note that consistent inflows over recent sessions suggest that large investors are gradually increasing exposure to the asset.
The most recent inflow momentum came from Bitwise’s BSOL ETF, which saw net inflows of around $36 million over the past week. Fidelity’s FSOL ETF has raised a new round of more than $1.8 million in fresh capital.
BSOL has received over $861 million in inflows since its launch (over 81% of the existing spot Solana ETF inflows). There are about $1.06 billion cumulative inflows across spot SOL ETFs. Also supporting the ETF momentum is increased activity in the derivatives market. Solana futures open interest soared to $6.4 billion from $4.94 billion on May 1.
There was an increase in the aggregated spot cumulative volume delta (CVD), with the difference between buying and selling orders rising to nearly $250 million from $163 million over five days, as SOL moved toward the $96 level.
Meanwhile, futures CVD increased to about $593.6 million after steady growth from May 5 onward. Analysts suggest this will indicate that buyers keep buying on sell-side liquidity and that, in a volatile time, bullish traders are hanging in, hanging out.
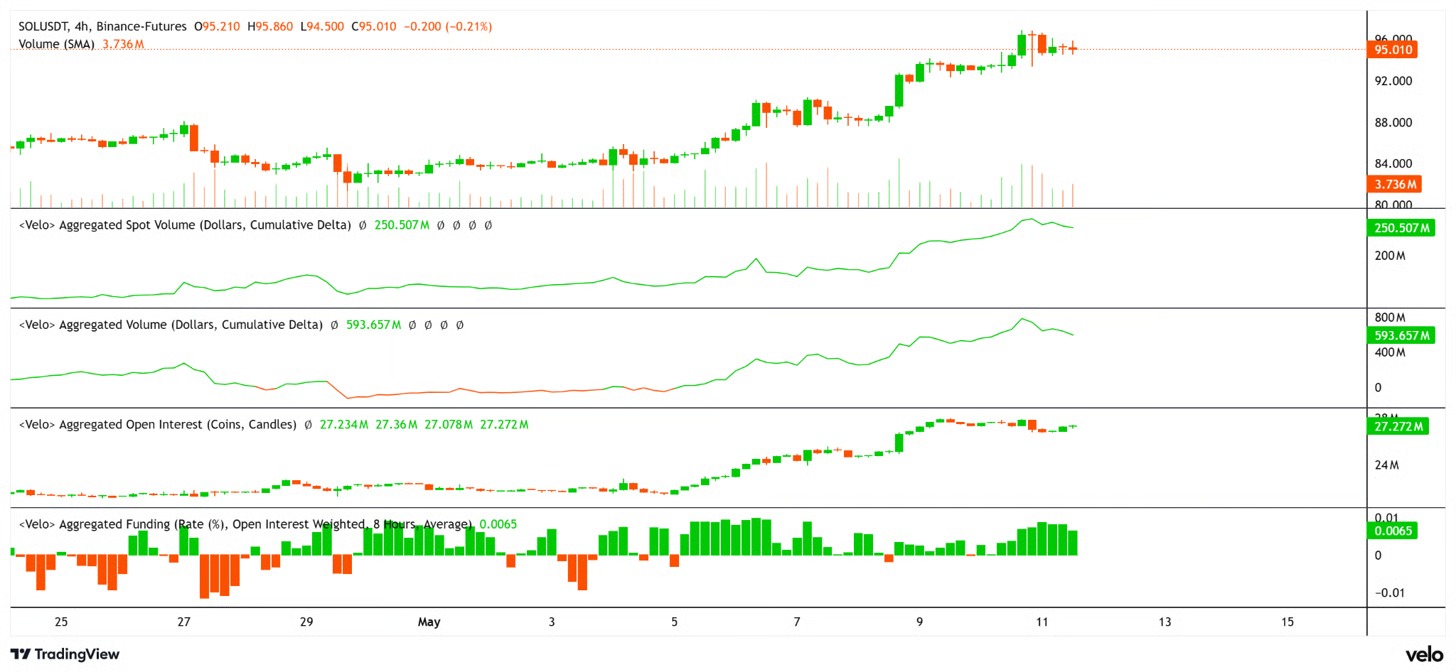 SOL price, aggregated open interest, spot, and futures CVD and funding rate. Source velo.chart
Funding rates have also remained positive at around 0.065%, indicating that traders remain willing to pay premiums to maintain long futures positions.
Why are traders watching the $120 level?
It is common for technical analysts to describe a double-structure base forming on higher time-frame charts. The trend is thus viewed as a bullish reversal signal, especially after long downtrends. Under a confirmed breakout, analysts think potential for the chart structure to pave the way for a move to the $120 region.
Then the technical setup becomes meaningful again, as Solana recently broke its 100-day exponential moving average for the first time since October 2025. And traders generally consider this indicator a sign that market momentum may be returning to buyers.
Analysts also observe little if any resistance between the $95 and $120 levels since Solana’s sharp 42% correction earlier this year. That could accelerate price movement if the buying pressure persists. But short-term momentum has begun to turn softer, towards the $95- $96 range.
Over the past 24 hours, spot buying activity and trading volume have flattened, suggesting traders are waiting for confirmation before lifting prices.
Some analysts say Solana’s recent upturn against Bitcoin may support further upside. SOL recently broke above a 231-day downtrend in the SOL/BTC daily chart, noted crypto analyst BATMAN. That breakout, according to the analyst, indicates that relative strength is improving against Bitcoin.
Should Solana experience a short-term pullback, the analyst identified the $89- $91 region as the closest support area. If held above that area, perhaps maintaining bullish momentum and further strengthening the case for a continued rally would be beneficial. Institutional demand through ETFs is also emerging as a prominent pillar of Solana’s market structure.
Don’t just read crypto news. Understand it. Subscribe to our newsletter. It's free.


 English (US)