

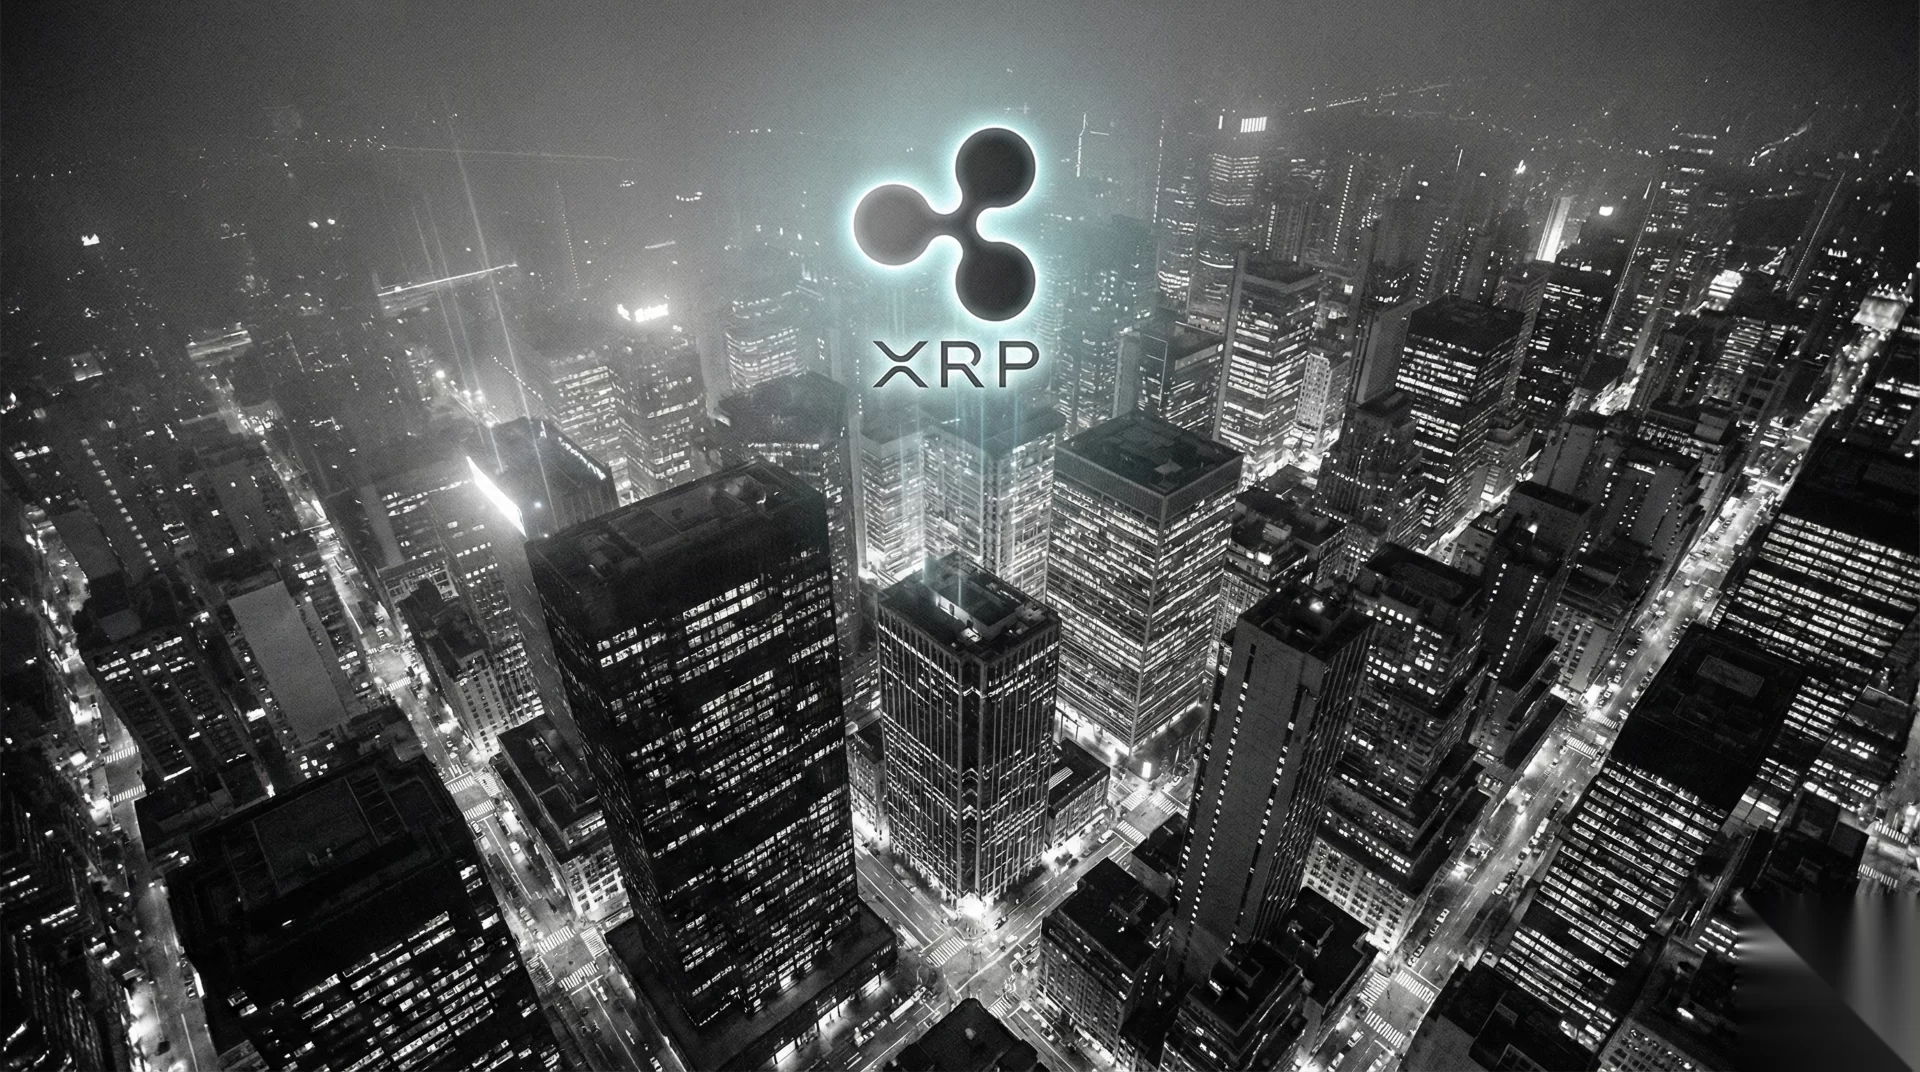
XRP, one of the widely followed cryptocurrencies, is nearing a pivotal technical point that could define its future price direction. According to insights from ripple-centric data provider XRP Update, the digital asset’s movement has been compressed within a symmetrical triangle pattern. This formation suggests an imminent end to the sideways trading phase, potentially leading to a substantial price shift.
Price Patterns Capture Market Participants’ Interest
XRP has been in a prolonged consolidation phase, sparking interest among traders and strategists who anticipate a looming breakout. Current market data from CoinCodex places XRP at approximately $1.13, with market observers keenly watching for signs signaling the end of this stalled progression.
XRP Update reports a classic symmetrical triangle on the price chart, delineated by a declining resistance boundary and a rising support line. This setup indicates that XRP is close to reaching a critical juncture in its current trading pattern.
XRP Update notes that the price has formed a classic symmetrical triangle between a descending resistance line and an ascending support line, signaling that the coin is nearing the final phases of its current squeeze.
As XRP contracts towards the triangle’s peak, the prospect of an extended range-bound movement diminishes. Historically, such patterns lead to sizable reactions when price breaches beyond defined lines.
Should the digital currency break above the $2 resistance level with significant market activity, it could trigger renewed accumulation from investors. This potential uptrend may set the stage for an enduring climb, especially if institutional players take interest.
What Does The RSI Say?
Currently, technical indicators paint an encouraging picture for XRP’s potential path. The Relative Strength Index (RSI) is presenting a steady increase, backed by what experts call a hidden bullish divergence—an auspicious sign for price perseverance.

Mini glossary: RSI stands for Relative Strength Index, which helps determine if an asset is overbought or oversold. Hidden bullish divergence suggests momentum aligns with price elevation, signaling potential upticks.
- Repeated interaction with resistance and support signifies market equilibrium.
- A breakout, potentially toward the $2 mark, is informed by technical indicators.
- Analysts are optimistic, projecting potential advancement to the $3 zone if momentum persists.
As XRP edges closer to the decisive breakout, this technical configuration is considered by many experts to be one of the most intriguing in recent times. Whether it ignites a bullish rally or confirms a directional reversal, market participants are on alert.


 English (US)