

XRP is currently navigating a precarious path, shadowed by two distinct bearish patterns on its short-term charts since early June. These patterns, namely a head and shoulders formation and a bear flag, have emerged on the four-hour timeframe, heightening the risk of XRP dipping beneath the significant $1 threshold.
What is the head and shoulders pattern indicating?
Starting June 5, a head and shoulders pattern was observed within XRP’s pricing structure. In this classic formation, the central peak surpasses the adjacent shoulders, and a break below its supporting neckline implies a downward target. As of the latest analysis, XRP has completed its right shoulder and might plummet to the support near $1.09 initially.
“If XRP decisively breaks below the neckline at $1.09, the technical target for the head and shoulders pattern projects a move down to approximately $0.99.”
With these metrics, the primary bearish target for June is set at $0.99, reflecting a potential 10% decline from its current standing. However, a rally reclaiming the right shoulder peak of $1.12 and breaching the 20-period moving average on the four-hour chart may invalidate this bearish outlook.
A successful bullish turn could see XRP targeting the 50-period exponential moving average around the $1.15 territory, rendering a plausible 4.5% gain beyond present prices.
Is the bear flag pattern contributing to the selling pressure?
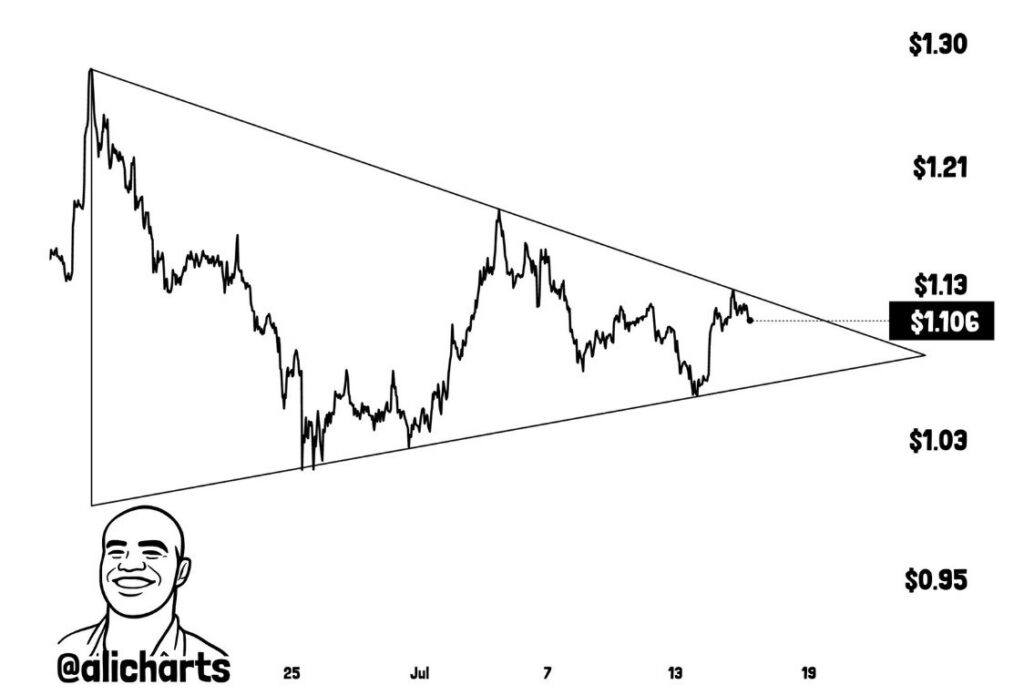
The four-hour chart reveals a bear flag pattern; XRP has moved within an ascending channel after a steep fall, indicating a potential continuation of the downward trend. As the week progressed, XRP challenged the lower trendline at around $1.10, with a robust four-hour close below this mark possibly confirming further declines.

“A confirmed close below $1.10 in the bear flag pattern could open the door to further losses, potentially targeting the $0.94 level for XRP.”
This scenario projects a technical target of $0.94, approximately 15% below current price levels. The RSI hovering at 43 signifies limited buying interest, emphasizing the bearish sentiment.
If XRP manages to break above $1.12 convincingly, this could dent the bearish framework. A firm breach over the significant resistance of $1.15 might delay additional sell-offs, pushing the price to the upper trajectory between $1.18 and $1.20.
Key insights from the on-chain analysis introduce implications for traders:
- If XRP falls below $1.09, watch for a drop toward $0.99.
- The bear flag pattern could see XRP declining to $0.94 if bearish pressures prevail.
- On-chain data using MVRV price bands suggest heightened risks around $0.96.
On-chain metrics through MVRV price bands underscore ongoing downside risks for XRP. The MVRV gauge, contrasting the current price with coins’ average on-chain movement costs, warns that the lower green band, marking prior lows in 2018, 2020, and 2022, aligns near $0.96, possibly serving as the next significant target should pressure intensify.
Disclaimer: The information contained in this article does not constitute investment advice. Investors should be aware that cryptocurrencies carry high volatility and therefore risk, and should conduct their own research.


 English (US)