
 5 hours ago
904
5 hours ago
904

While the price of XRP has been weighed down by broader market sentiment, the asset’s technical indicators suggest it might be gearing up for a rally, with the $2.5 resistance level in sight.
To this end, XRP may be entering a bullish reversal after a prolonged correction, as the TD Sequential indicator has flashed a buy signal on the daily chart, with confirmation possibly imminent, according to insights shared by Ali Martinez in an X post on November 8.
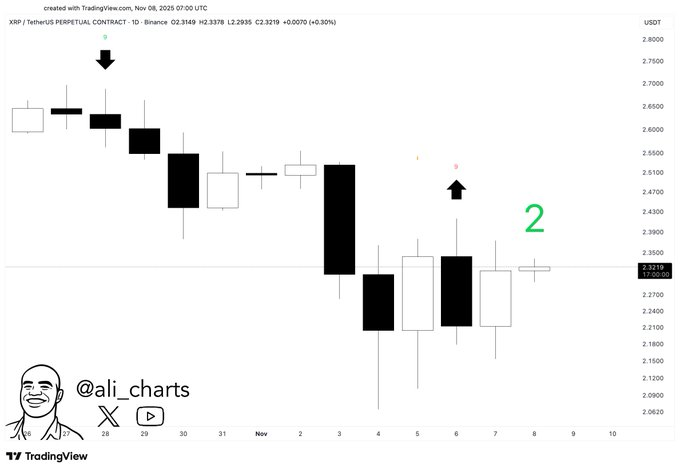 XRP price analysis chart. Source: TradingView
Notably, the TD Sequential indicator counts a series of price candles to identify when an asset is overextended or ready for a reversal. A completed nine-count in a downtrend often signals fading selling pressure and the potential for a rebound.
XRP key price levels to watch
According to the analysis, XRP appears to have established a temporary floor around the $2.20 to $2.25 range, where recent candles show signs of stabilization following a sharp decline from the $2.55–$2.60 zone earlier in November.
Now, the emergence of the TD Sequential “2” candle suggests early confirmation of bullish momentum, with traders now watching for a decisive move above $2.35 to validate the setup.
If buying pressure builds, XRP could retest resistance around $2.50, a former support level before the recent pullback. A breakout above it would reinforce the bullish outlook and signal a potential short-term recovery.
Conversely, failure to confirm the signal could push the asset back toward support at $2.10–$2.00, where buyers are likely to step in.
The technical outlook comes as the asset has suffered from significant whale selling, which has derailed its momentum toward $2.5.
However, XRP remains backed by strong fundamentals. For instance, Ripple has raised $500 million in a new funding round led by Fortress Investment Group, Citadel Securities, Pantera Capital, and Galaxy Digital, valuing the company at $40 billion.
Following the news, XRP briefly surged 5.7% before paring gains amid broader market weakness.
On the other hand, Ripple President Monica Long said the funding highlights the firm’s sustained growth and focus on expanding blockchain-based financial infrastructure. She ruled out any near-term IPO plans, citing strong liquidity and continued private ownership.
XRP price analysis
As of press time, XRP was trading at $2.28, having dropped about 1.7% in the past 24 hours, while on the weekly chart, the asset is down over 10%.
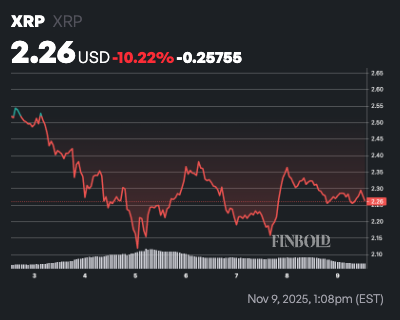 XRP seven-day price chart. Source: Finbold
Currently, XRP remains below both the 50-day SMA ($2.64) and 200-day SMA ($2.65), confirming short-term bearish pressure despite the longer-term uptrend remaining technically intact. The narrow $0.01 gap between the two SMAs signals weakening momentum and raises the risk of an impending death cross if selling persists.
Meanwhile, the 14-day RSI at 42.26 (neutral) shows neither overbought nor oversold conditions, indicating balanced momentum but leaning slightly downward, with no strong reversal signal yet.
Featured image via Shutterstock
The post XRP flashes major buy signal; Is $2.5 next? appeared first on Finbold.


 English (US)