
 4 hours ago
1551
4 hours ago
1551

The Ethereum (ETH) Rainbow Chart is suggesting that the second-ranked cryptocurrency is likely to trade across a diverse range of prices by the end of the month.
Notably, the outlook comes as Ethereum continues to be weighed down by broader market sentiment, which has seen increased selling pressure.
By press time, ETH was trading at $3,425, up almost 0.5% in the past 24 hours, while on the weekly timeline, the asset is down 12%.
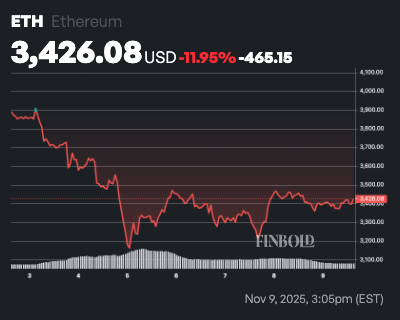 ETH seven-day price chart. Source: Finbold
ETH price prediction
Now, the Ethereum Rainbow Chart, a long-term valuation model using a color-coded logarithmic curve, projects potential price levels for November 2025.
At the top of the spectrum, the “Maximum Bubble Territory” is projected between $15,286.39 and $21,767.19, indicating extreme overvaluation and speculative exuberance. Just below this, the “But have we earned it?” band spans $10,701.94 to $15,286.39, typically representing a heated but not yet euphoric market.
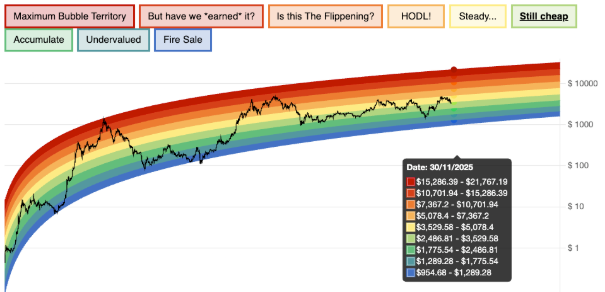 ETH Rainbow Chart. Source: Blockchain Center
The “Is this the Flippening?” level ranges from $7,367.2 to $10,701.94, marking strong bullish momentum where investors might speculate on Ethereum surpassing Bitcoin’s dominance. The “HODL!” zone, between $5,078.4 and $7,367.2, reflects healthy growth and sustained optimism among long-term holders.
Further down, the “Steady…” band lies between $3,529.58 and $5,078.4, pointing to a market in equilibrium where Ethereum is fairly valued. The “Still cheap” ($2,486.81–$3,529.58) and “Undervalued” ($1,775.54–$2,486.81) ranges suggest the asset remains attractively priced for accumulation.
Finally, the lowest bands, “Accumulate” ($1,289.28–$1,775.54) and “Fire Sale” ($954.68–$1,289.28), reflect periods of excessive pessimism, offering potentially undervalued entry points.
ETH’s ideal price for November 30
With Ethereum trading around $3,400, it sits at the lower edge of the “Steady…” band, just above the “Still cheap” zone. This placement suggests the asset remains moderately undervalued relative to the chart’s growth trajectory.
If market sentiment stays stable and follows its historical logarithmic path, Ethereum’s equilibrium price by November 30 could fall between $3,500 and $5,000, aligning with the midpoint of the “Steady…” band.
While not a scientific forecast or investment advice, the Rainbow Chart contextualizes Ethereum’s cyclical valuation trends within its historical performance.
Featured image via Shutterstock
The post Ethereum Rainbow Chart predicts ETH for November 30 appeared first on Finbold.


 English (US)