
 3 months ago
14414
3 months ago
14414


The post Will Bitcoin Hit $75K, As Institutions See A Dip Opportunity? appeared first on Coinpedia Fintech News
Bitcoin acted as a good shock absorber for this time global chaos war-like event. It briefly dipped to $63000 after the U.S.-Israel-Iran attack, but had a quick rebound near $67,000 on Feb 28.
While indicators in mid-term paint a neutral to bearish continuation trend, the BTC Onchain data indicate a bullish approach of large and small investors.
The ongoing market sentiments and performance indicators show a potential rally of Bitcoin Price to $75K, after breaking the horizontal channel formed since early Feb.
Bitcoin ETF’s Are All Green, Funding Rate Retuerned To Positive.
The strong resilience of the Bitcoin price to a war situation has impressed institutional players; the big investors see this dip as an entry opportunity.
As shown in SoSo data, Bitcoin BTC spot exchange-traded fund (ETFs), have recorded a total inflow of $458.19 million on March 2 Closing. Which is strong and concurrent.
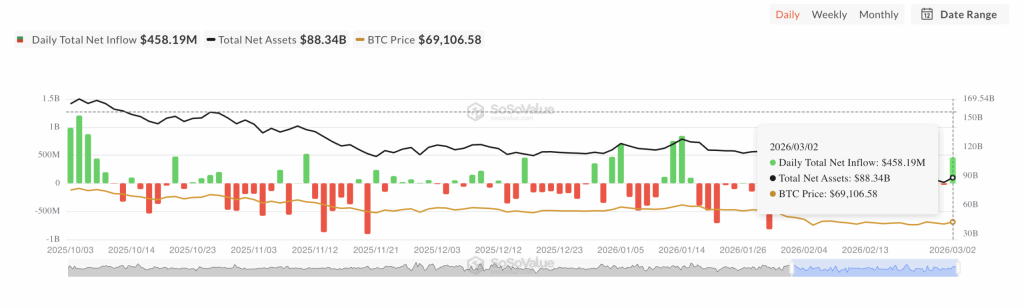 Soso value : Bitcoin ETF inflow/Outflow
The flex is none of the 12 active ETFs registered any net outflow. Showing ‘Smart Money Confidence in big investors and so influencing the retail traders too.
Additionally, Bitcoin’s funding rate is now back to the positive zone with a rate of 0.0022%. As the funding rate expresses a settlement between perpetual traders to keep the contract price in line with spot performance.
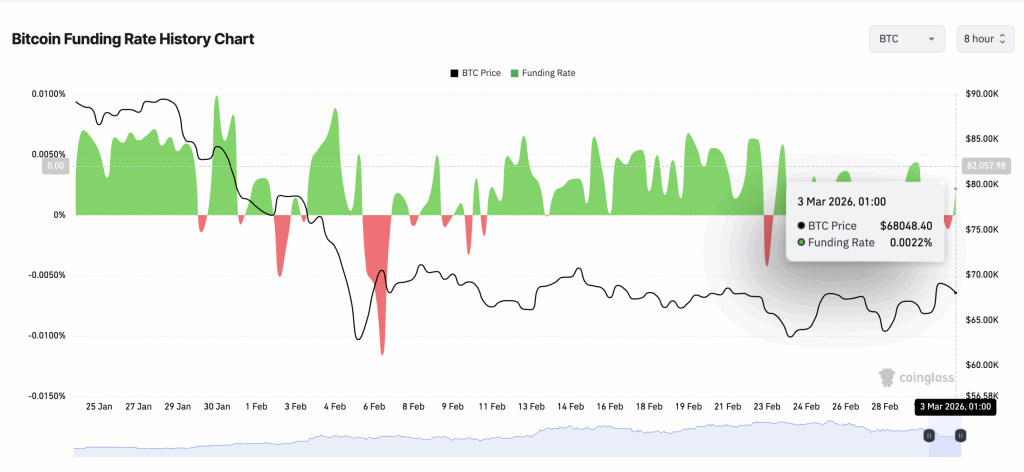 Bitcoin Funding Rate : CoinGlass
A positive rate suggests long positions are in demand.
The SAR Chart Denies Bullish Momentum
While all the signs print a positive perspective for Bitcoin price growth, the indicator Parabolic Stop and Reverse (SAR) stays bearish.
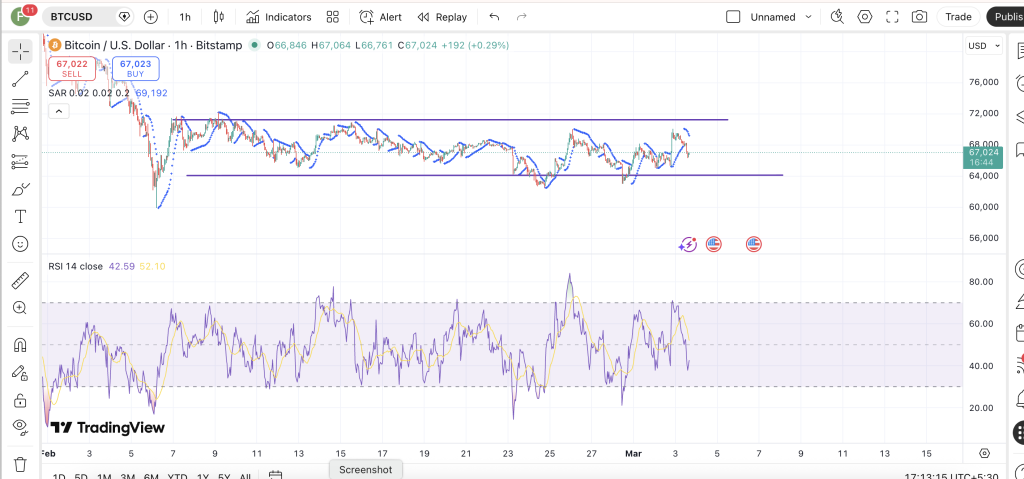 Bitcon SAR and RSI
It is a trend reversal indicator that says having dots below the price line shows a bullish sign, and having dots above the price line is bearish.
Furthermore, the Relative Strength Index (RSI) at 42 shows growing selling pressure of the asset
BTC/USDT Targets $75K with a short pullback.
Trading at $66,826 at press time, Bitcoin is travelling inside a horizontal channel since early February.
Bitcoin has completed a strong bullish expansion after a clear market structure shift and is now pulling back into a key demand zone around $65K–$65.7K.
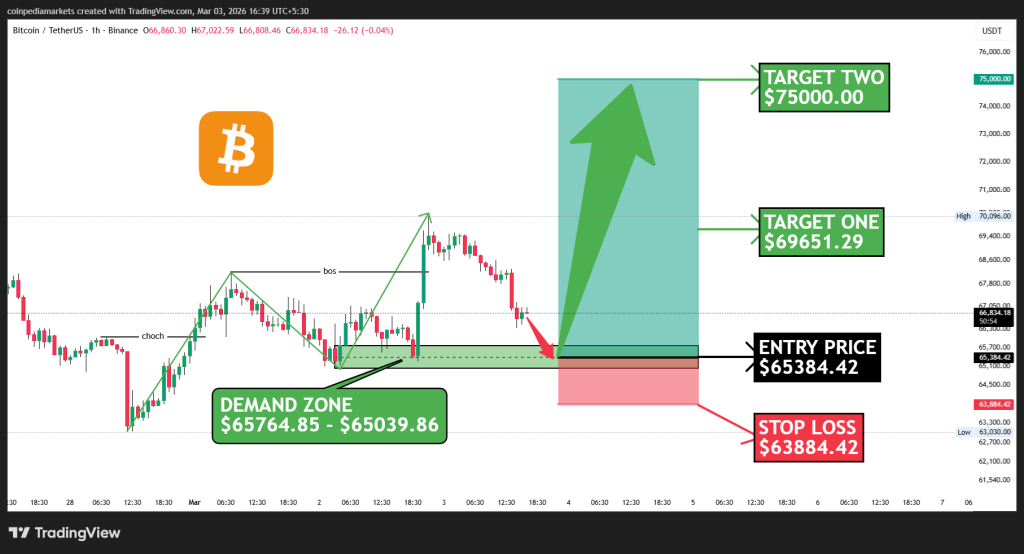 BTC:USDT
Price is currently reacting from this support area, which could trigger a continuation move toward $69.6K, followed by a potential expansion toward $75K if buyers maintain control.
However, a breakdown below $63.8K would invalidate the bullish outlook and open the door for a deeper correction.


 English (US)