
 2 months ago
10952
2 months ago
10952

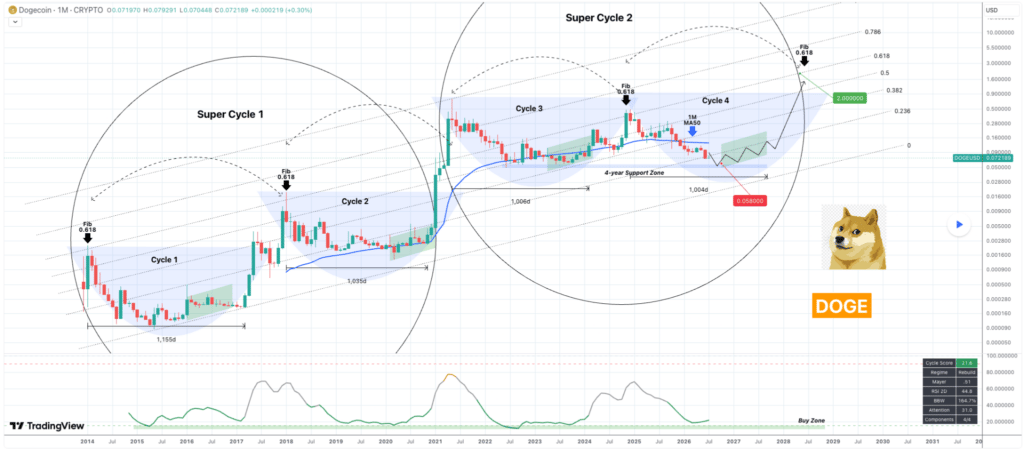
As XRP continues to face increased consolidation, technical indicators suggest that the asset is approaching a critical setup that could trigger a sharp price move.
In this context, the consolidation is occurring within a symmetrical triangle pattern that shows XRP compressing between descending resistance around $1.45 and rising support near $1.35.
According to insights shared by prominent analyst Ali Martinez in an X post on May 2, XRP’s narrowing price action suggests volatility is tightening as the token approaches the apex of a symmetrical triangle formation, a setup that often precedes a decisive breakout.
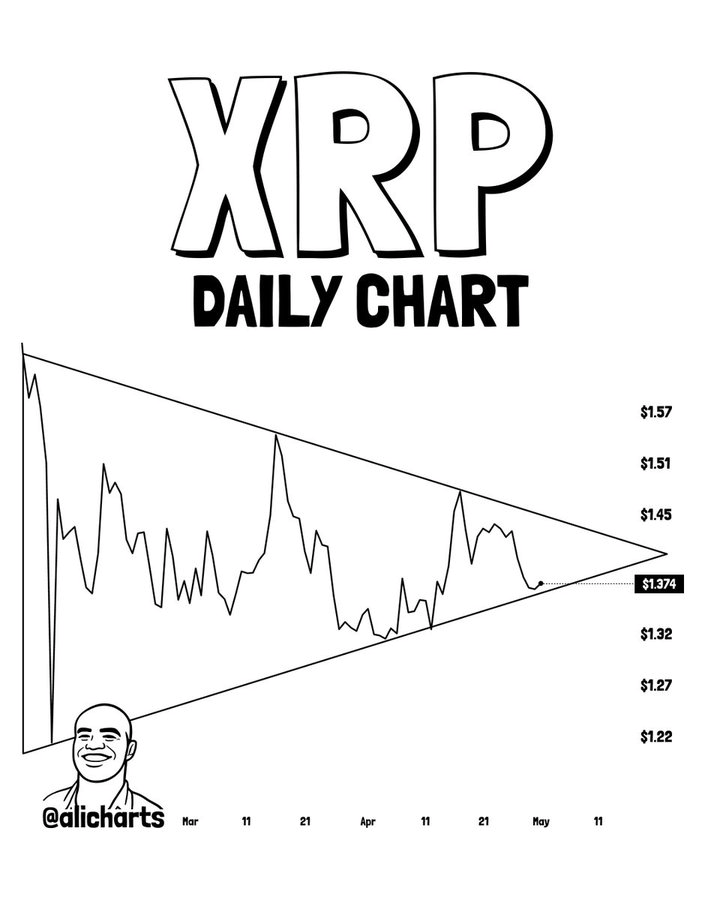 XRP price analysis chart. Source: Ali Martinez
Based on the triangle’s height, the analyst projects a potential 26% move in either direction.
Martinez noted that a daily close above the $1.45 resistance level could push XRP toward $1.82, while a breakdown below the $1.35 support zone may trigger a decline toward $1.
The analyst also highlighted the $1.35 to $1.45 range as a key consolidation zone where traders risk getting caught in false breakouts.
XRP price testing long-term support
A similar outlook was shared by pseudonymous analyst Batman, who said XRP is testing a long-standing ascending support trendline that has held since early February.
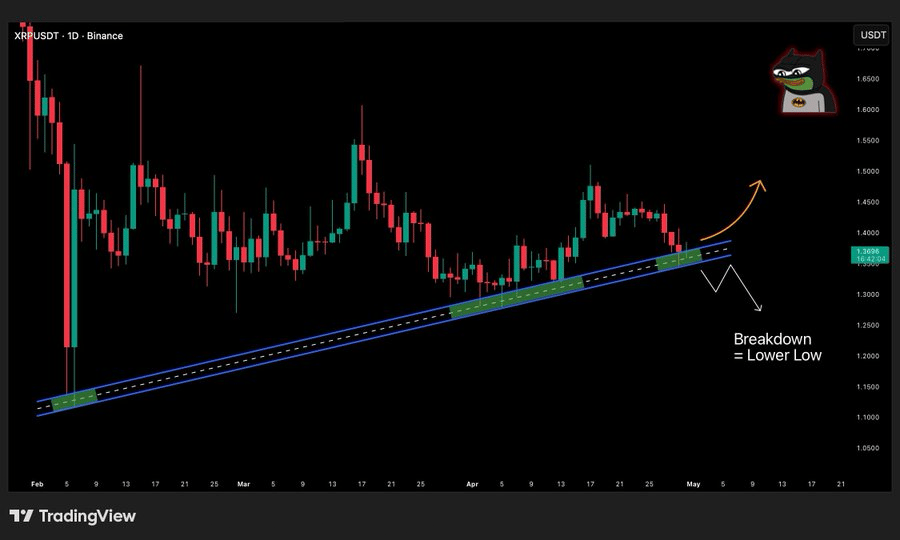 XRP price analysis chart. Source: TradingView
The analyst identified the $1.36 region as a make-or-break zone, with a rebound potentially driving the token toward the $1.45 to $1.50 resistance range.
However, failure to hold support could trigger a sharper decline toward $1.20 or lower, reinforcing bearish continuation signals.
Overall, XRP’s near-term outlook remains closely tied to its technical setup and broader cryptocurrency market sentiment, with the asset lacking major network-specific catalysts in recent sessions.
XRP price analysis
By press time, XRP was trading at $1.39, up about 0.7% in the past 24 hours, while remaining down more than 3% on the weekly chart.
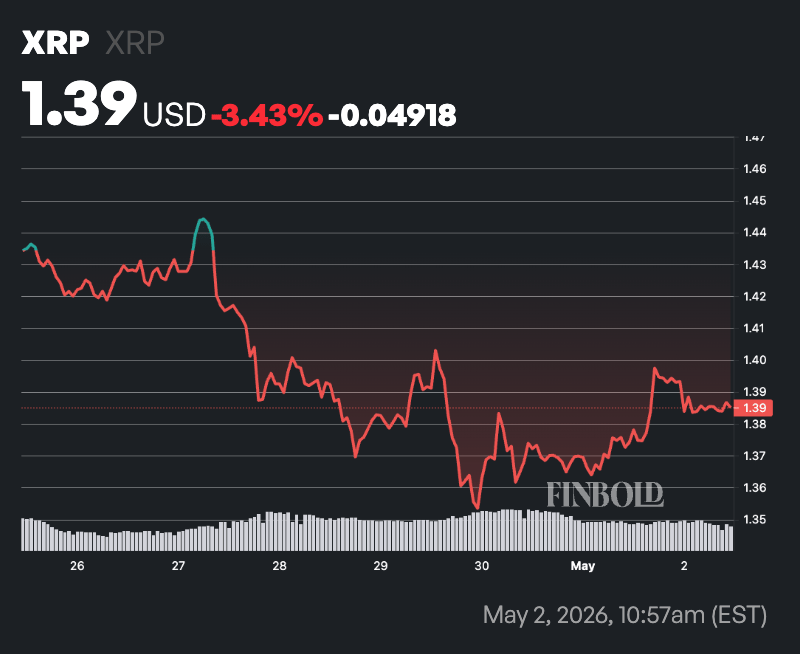 XRP seven-day price chart. Source: Finbold
At the current valuation, XRP’s technical indicators point to a cautious near-term outlook. The token is sitting exactly at its 50-day simple moving average (SMA) of $1.39, suggesting that price momentum is currently balanced between buyers and sellers in the short term.
However, XRP remains well below its 200-day SMA of $1.81, indicating that the broader long-term trend is still under pressure and that bullish momentum has yet to fully recover.
Meanwhile, the 14-day Relative Strength Index (RSI) stands at 44.07, placing XRP in neutral territory. This signals that the asset is neither overbought nor oversold.
The post Why XRP is set for a 26% move as key buying zone emerges appeared first on Finbold.


 English (US)