
 3 months ago
10435
3 months ago
10435

A new technical outlook suggests that XRP could be positioning for a significant breakout in the next major market cycle, with a projected upside toward $13.
The forecast, presented by prominent cryptocurrency analyst Ali Martinez in an X post on April 26, pointed to a long-term chart pattern that has been forming over several years.
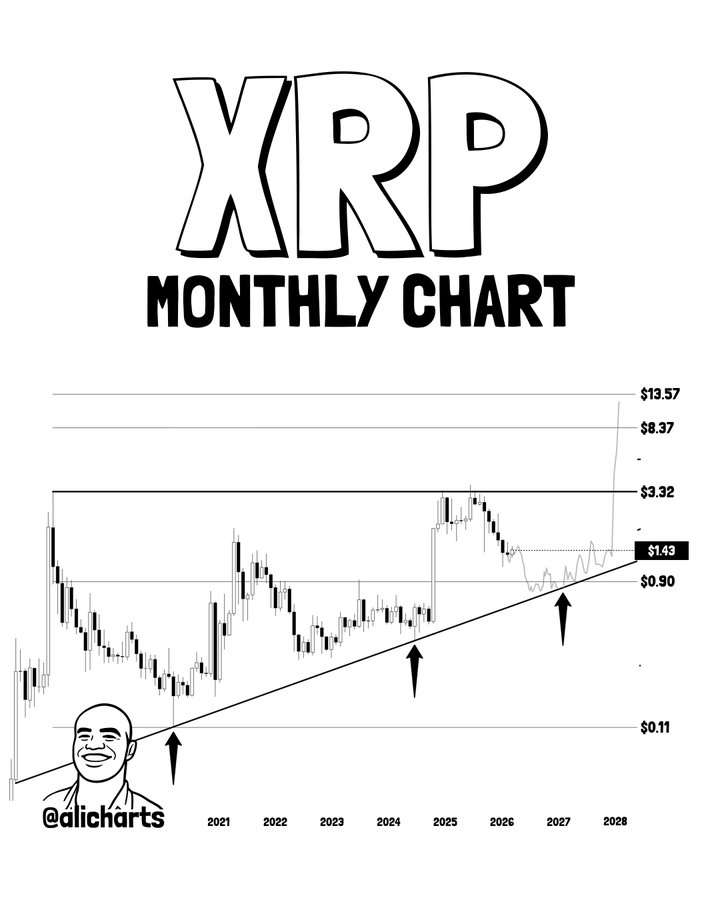
According to the analysis, XRP has been trading within a broad multi-year triangle, a structure often associated with accumulation phases before large price expansions.
The outlook highlighted a steady pattern of higher lows, supported by a rising trendline in place since around 2021.
This support has been tested multiple times, each reinforcing the strength of the broader uptrend.
 XRP price analysis chart. Source: Ali Martinez
A key level is the $0.90 zone, near the triangle’s lower boundary, seen as a potential bear market floor where buying interest has consistently emerged. Recent price action shows XRP respecting this support, bouncing, and beginning to trend upward.
On the upside, $3.32 stands out as a major resistance level and prior rejection point. A breakout above it could confirm bullish momentum and pave the way for further gains.
XRP price next target
Based on the triangle structure, the long-term projection targets $13 by 2028. If XRP rises from its current price to $13, its market capitalization would increase proportionally from $87.8 billion to approximately $800 billion, assuming the circulating supply remains unchanged.
Such growth could push XRP into the second spot by market cap, assuming Ethereum (ETH) records minimal growth over the same period.
Overall, the outlook suggests a gradual climb in the near term, followed by stronger acceleration as momentum builds, a pattern typical of large consolidation breakouts.
This comes at a time when XRP continues to consolidate after earlier 2026 volatility and a pullback from peaks near $3.65 in late 2025. It remains roughly 60–70% below its all-time high, with recent price action reflecting broader crypto market flows rather than strong independent catalysts.
XRP price analysis
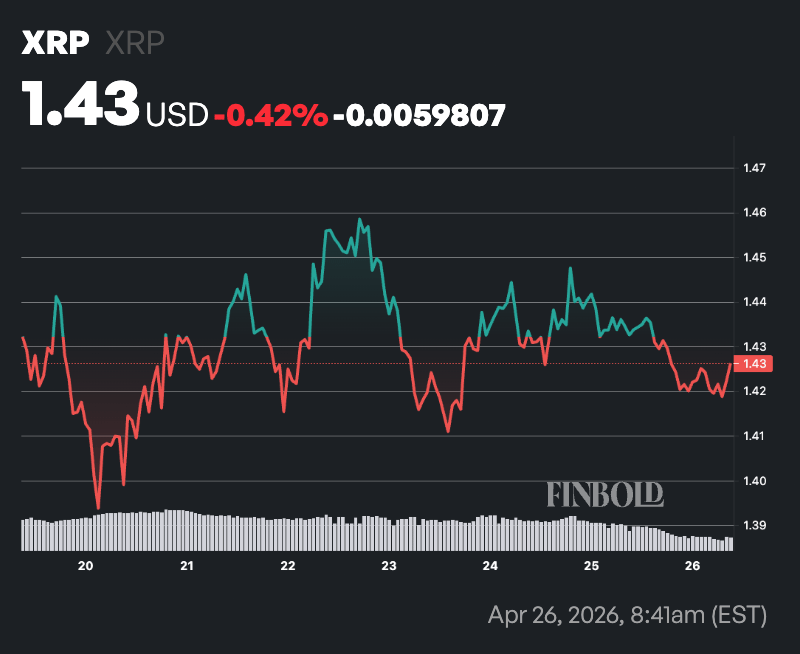
By press time, XRP was trading at $1.43, down about 0.5% over the past 24 hours and 0.4% on the week.
 XRP seven-day price chart. Source: Finbold
Technically, the market appears steady but lacks strong direction. Price is holding just above the 50-day SMA at $1.39, suggesting short-term support remains intact, while the higher 200-day SMA at $1.85 points to ongoing long-term bearish pressure.
The RSI at 56.37 supports a neutral outlook, indicating balanced momentum with no signs of overbought or oversold conditions. Overall, XRP is consolidating rather than showing a clear breakout or breakdown.
The post Why XRP is set for $13 in the next bull run, according to expert appeared first on Finbold.


 English (US)