
 3 weeks ago
5264
3 weeks ago
5264

Key Takeaways:
- Our Tron price prediction anticipates a high of $0.595 by the end of 2026.
- In 2028, TRX will range between $0.822 and $0.949, with an average price of $0.881.
- In 2032, TRX will range between $2.51 and $2.86, with an average price of $2.68.
TRX is the native token of the Tron network used to govern and settle transaction fees. In retrospect, Tron (TRX) has performed better than most mega-altcoins. Over the long term, TRX is set to trend higher.
Is TRX a good investment? Will it go up? Where will it be in three years? Let’s get into the TRX price prediction to answer these questions and more.
Overview
| Cryptocurrency | Tron |
| Ticker | TRX |
| Current price | $0.321 (-2.09%) |
| Market cap | $30.52B |
| Trading volume (24-hour) | $828.45M |
| Circulating supply | 94.84B TRX |
| All-time low | $0.001091 on Sep 15, 2017 |
| All-time high | $0.4313 on Dec 04, 2024 |
| 24-hour low | $0.3289 |
| 24-hour high | $0.3211 |
Tron price prediction: Technical analysis
| Metric | Value |
| Price Volatility (30-day variation) | 3.98% |
| 50-day SMA | $0.3408 |
| 200-day SMA | $0.3095 |
| Market Sentiment | Bearish |
| Fear and greed index | 13 (Extreme Fear) |
| Green days | 13/30 (43%) |
TRON Price Analysis
TL;DR Breakdown
- Tron price analysis confirmed a downward trend with price correcting to $0.321.
- Cryptocurrency loses 2.09% of its value.
- TRX faces resistance around $0.332.
On June 26, 2026, Tron price analysis reveals a bearish trend for the altcoin. The altcoin’s price has further decreased to $0.321 today, and it has lost 2.09% in value in the last 24 hours. Selling pressure formed when the token touched $0.333 on June 22 amid positive market sentiment. However, bears are now back on track, and trying to crush the support present at $0.316.
TRX/USD 1-day chart analysis
The one-day Tron technical analysis shows a negative outlook for TRON’s price prediction, as sellers are taking the price lower following continuous corrections from the weekly high of $0.333.The coin’s price decreased to $0.321 after today’s correction. However, the coin is still trending just below its upper price envelope of the year, but it also faces the nearest resistance at $0.332.
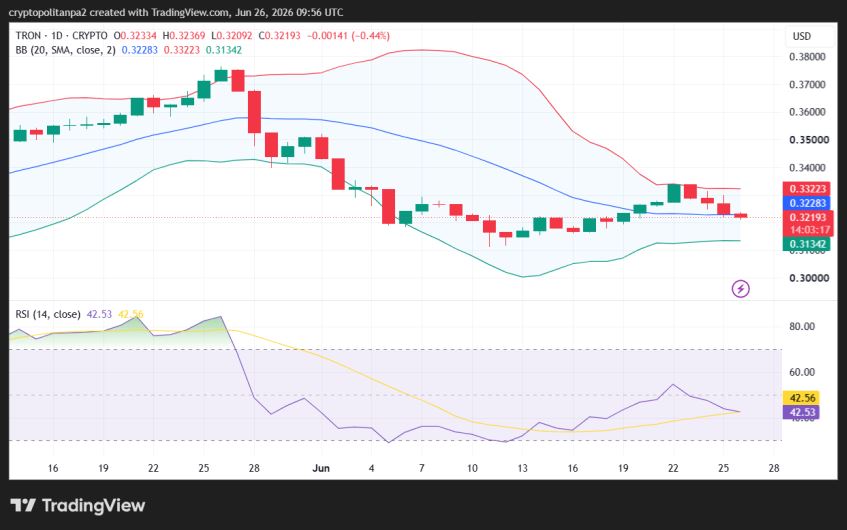 TRX/USD 1-day price chart. Source: TradingView
The volatility level is mild as the Bollinger Bands are covering comparatively less area. The indicator’s upper limit is currently at $0.332, indicating resistance; meanwhile, the lower limit has adjusted to $0.313, acting as the strongest support.
A number of technical indicators show bearish signs, but the Relative Strength Index (RSI) indicator is currently hovering in the neutral region as it moves downward. The indicator’s value has decreased to index 42 in the past 24 hours. The downward curve on the RSI graph reflects an imbalanced market setup. If the bears persist, we can expect a further downturn in the coin’s value.
TRX/USD 4-hour chart analysis
The four-hour candlestick charts price analysis of Tron also indicates a further correction amid a larger decreasing trend for the cryptocurrency. The TRX/USD price has decreased to $0.321 in the past few hours. Immediate support is also present just below the current price level at $0.320, as the token is floating above that level. Simultaneously, the high volatility suggests a higher chance of a price reversal or further price depreciation.
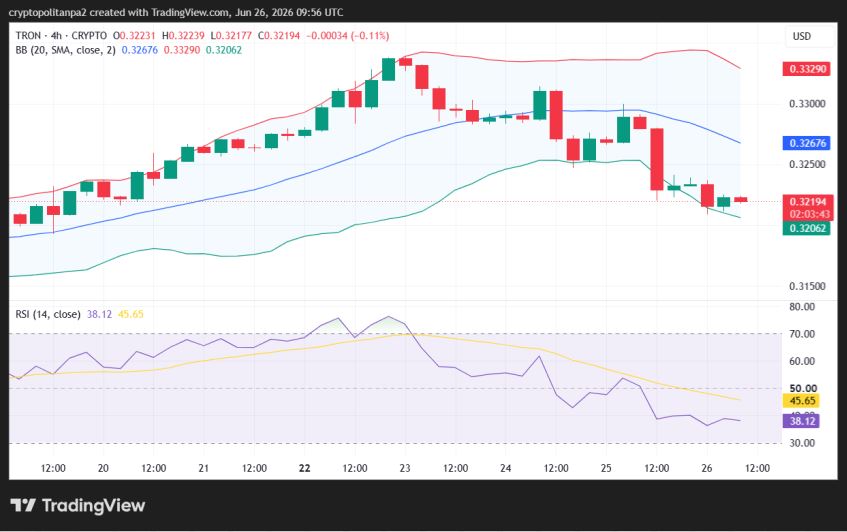 TRX/USD 4-hour price chart. Source: Tradingview
The Bollinger Bands are expanded and the distance between them is wide, hinting at high volatility on the price chart. This level of volatility signals increased market movements. Moving ahead, the upper Bollinger Band has shifted to $0.332, indicating the resistance point. Conversely, the lower Bollinger Band has moved to $0.320, securing the support.
Multiple technical quantitative indicators are bearish, but the RSI indicator is in the neutral range. The indicator’s score has slightly decreased to 38 in the past four hours. The slightly downward curve on the indicator’s graph signifies bearish presence; if the bears succeed in continuing their lead, a further downtick in the coin’s value can be expected.
TRX technical indicators: Levels and actions
Daily simple moving average (SMA)
| Period | Value ($) | Action |
| SMA 3 | 0.3299 | SELL |
| SMA 5 | 0.3287 | SELL |
| SMA 10 | 0.3245 | SELL |
| SMA 21 | 0.3232 | SELL |
| SMA 50 | 0.3408 | SELL |
| SMA 100 | 0.3308 | SELL |
| SMA 200 | 0.3095 | BUY |
Daily exponential moving average (EMA)
| Period | Value ($) | Action |
| EMA 3 | 0.3282 | SELL |
| EMA 5 | 0.3276 | SELL |
| EMA 10 | 0.3261 | SELL |
| EMA 21 | 0.3277 | SELL |
| EMA 50 | 0.3318 | SELL |
| EMA 100 | 0.3275 | SELL |
| EMA 200 | 0.3180 | BUY |
What can we expect from Tron price analysis next?
Tron price analysis gives a bearish prediction regarding the ongoing market events. The coin value has decreased to $0.321 today. At the same time, the cryptocurrency lost up to 2.09 percent of its value during the past 24 hours. Technical indicators give bearish signals, and the price charts also reveal a solid support for the sellers, as the price may decrease below $0.316 again.
Is TRX a good investment?
TRX is a coin with utility that continues to trade higher, indicating growing adoption among crypto investors. Despite this, the coin remains a victim of uncertainties and volatility. TRON’s utility is closely tied to stablecoins and regulatory frameworks; positive compliance milestones can act as macro catalysts for growth.
TRON functions as the primary transport rail for Tether (USDT), with a significant volume of stablecoin supply on its network.
TRON is a dominant blockchain for Tether (USDT) transfers due to high transaction speeds and low fees, underpinning its network value. It is advised to do your own research, design an investment strategy according to your risk tolerance, and consult expert opinions before investing in the volatile market.
Why is Tron down?
Analysts use a variety of methods, including quantitative modeling, technical indicators, and on-chain metrics, to predict TRON’s future price.
Tron is showing bearish signs for the day. The coin has decreased to $0.321 amidst a rising downward trend. After losing significant support, buyers lost confidence, and the intraday trend resumed in a downward direction again.
Will Tron reach $0.5?
TRON (TRX) is projected to surpass the $0.50 level in 2026, with its predicted price expected to fluctuate within a range of $0.210 to $0.595 throughout the year. Market forecasters are generally bullish on TRON’s foundation, though price targets can vary widely based on methodology and market conditions.
Will Tron reach $1?
Yes, Tron should rise above $1 in 2029. During that period, its forecasted price will range between $1.09 and $1.25, which is quite higher than the current Tron price.
Can TRX reach $10?
Per expert analysis, Tron may not reach $10 before 2032, considering its future performance. However, the ongoing adoption of TRON’s decentralized finance ecosystem, including lending protocols and decentralized exchanges, drives consistent network usage.
What will be the price of 1 TRX in 2026?
The average Tron price for 2026 is expected to be $0.349. It is important to remember that higher on-chain activity increases demand for bandwidth and energy resources, which are tied to TRX staking and usage; sustained growth in applications or transfers tends to support valuation, while declining activity reduces demand pressure.
What will be the price of TRON in 2030?
The highest price of Tron in 2030 is expected to be around $1.67. TRON utilizes an automated token-burning mechanism that permanently removes TRX from circulating supply, contributing to deflationary pressure and potential price increases.
What will TRX be worth in 5 years?
The minimum expected price of Tron after 5 years will be $2.86, which makes it a good option to buy TRX. If TRON continues to lead in stablecoin settlement and expands its DeFi footprint, a multi-fold increase in TRX price over five years is possible, with forecasts clustering around $1.50 to $2.00 by 2031.
Does Tron have a good long-term future?
According to the Tron price predictions, Tron is set to trade higher in the coming years as the Tron blockchain evolves. However, factors like market crashes, regulatory developments, or difficult regulations could invalidate this bullish theory.
Analyzing fundamental factors and technical factors like on-chain activity, network usage, and market liquidity reveals that trx trades still carry uncertainty despite their strong history. Ultimately, long term growth and investor confidence depend heavily on broader market trends, expanding decentralized finance utility, and growing institutional adoption of these digital assets.
As widespread adoption increases, key factors such as network activity, user input, and the efficiency of smart contracts running on a delegated proof of stake mechanism will dictate the ecosystem’s future and the long term outlook of the coin.
Recent news/opinions on Tron
- Securitize has launched its tokenized private credit fund, HLSCOPE, on Tron. HLSCOPE is already available on Ethereum and some other chains.
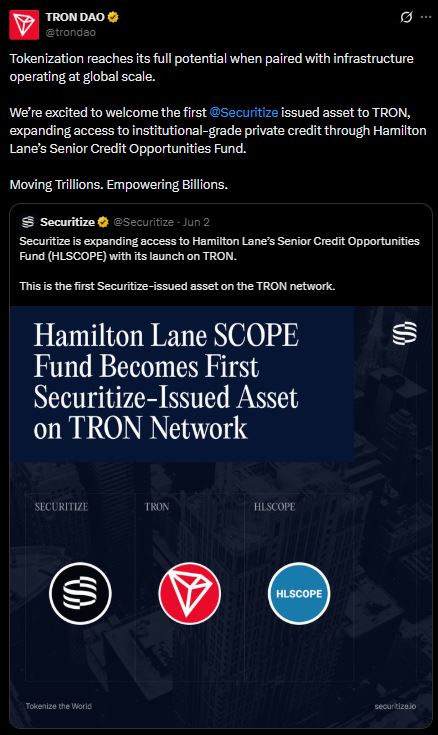 Securitize expands to TRON.
Tron price prediction June 2026
The current forecast suggests that a break of resistance will result in a mini bull run, with the next target at $0.380. This month, TRX will trade at an average of $0.320 and drop to $0.281 at its lowest.
| Month | Potential low ($) | Potential average ($) | Potential high ($) |
| June | 0.281 | 0.320 | 0.380 |
Tron price prediction 2026
The technical indicators are bullish on TRX in the second half of 2026. It is anticipated to trade between $0.210 and $0.595, with an average price of $0.349.
| Year | Potential low ($) | Potential average ($) | Potential high ($) |
| 2026 | 0.210 | 0.349 | 0.595 |
Tron price predictions 2027-2032
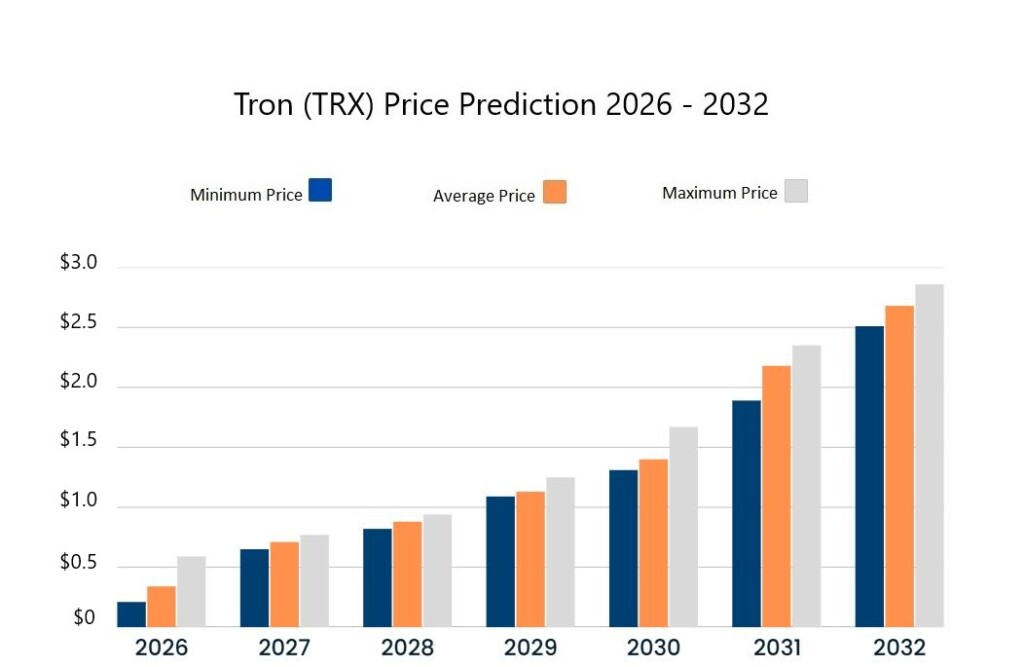
| Year | Potential low ($) | Potential average ($) | Potential high ($) |
| 2027 | $0.651 | $0.710 | $0.772 |
| 2028 | $0.822 | $0.881 | $0.949 |
| 2029 | $1.09 | $1.13 | $1.25 |
| 2030 | $1.31 | $1.40 | $1.67 |
| 2031 | $1.89 | $2.18 | $2.35 |
| 2032 | $2.51 | $2.68 | $2.86 |
Tron price prediction 2027
TRON will experience more bullish momentum in 2027. According to the TRX forecast, it will range between $0.651 and $0.772, with an average price of $0.710.
Tron price prediction 2028
The TRX prediction climbs even higher in 2028; according to the prediction, it will range between $0.822 and $0.949, with an average closing price of $0.881.
Tron price prediction 2029
The analysis suggests a further acceleration in TRX’s growth by 2029. According to the Tron price prediction, the price of Tron will range between a minimum price of $1.09 and a maximum price of $1.25. The average price for the year will be $1.13.
Tron price prediction 2030
According to the Tron forecast for 2030, TRX price will reach a maximum and minimum of $1.67 and $1.31, respectively, with a year-round average of $1.40.
Tron price prediction 2031
The Tron TRX price prediction for 2031 indicates a price range of $1.89 and $2.35 and an average future value of $2.18, considering the future price movements.
Tron price prediction 2032
The Tron price forecast for 2032 sets the high at $2.86. The lowest price for the year will be $2.51, and the average price will be $2.68.
 TRX price prediction 2026-2032. Source: Cryptopolitan
Tron market price prediction: Analysts’ TRX price forecast
| Platform | 2026 | 2027 |
| Digitalcoinprice | $0.29 | $0.12 |
| CoinCodex | $0.4699 | $0.5144 |
Cryptopolitan’s Tron price prediction
At current levels, Tron remains bullish. According to our predictions, TRX will achieve a high of $0.595 in the second half of 2026. In 2027, it will range between $0.651 and $0.772, with an average of $0.710. Note that the predictions are not investment advice. Seek independent professional consultation or do your research.
Tron historic price sentiment
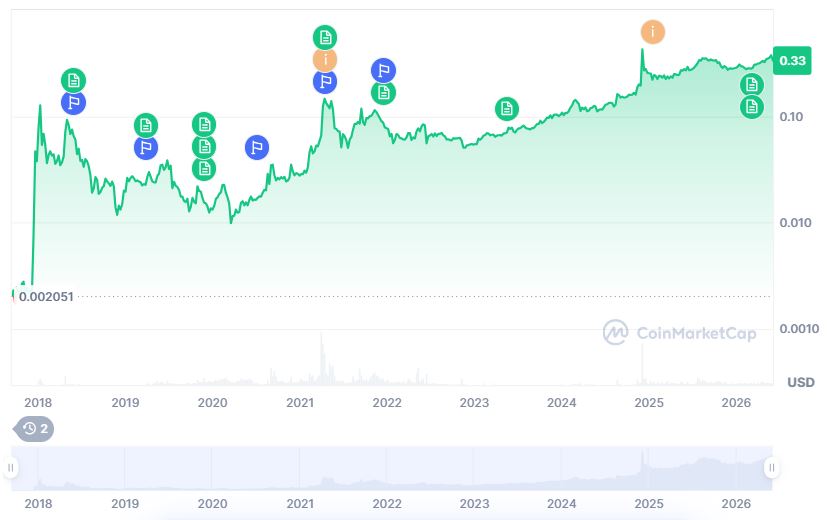 TRON price history.
- Tron, founded by Justin Sun in 2017, raised $70 million through an ICO the same year; it launched its mainnet in May 2018 and migrated TRX from Ethereum to Tron in June, which temporarily boosted TRX’s price to $0.09.
- TRX reached an all-time high of $0.3004 in January 2018 before dropping below $0.05 a month later; it consistently traded under $0.05 until late 2020, when it began to rise again.
- In 2021, it reached a high of $0.16. Tron was also reorganized as a DAO as Justin stepped down as CEO of Tron Foundation.
- TRX was in a bear trend for the best part of 2022, as per crypto market data.
- In 2023, TRX maintained a consistent bull run, rising from a low of $0.05, increasing its market capitalization significantly.
- In March 2023, the SEC sued Justin for allegedly selling unregistered securities and promoting Tron and Bittorent tokens.
- In February 2024, Circle’s announcement to cease USDC on Tron led TRX to correct from $0.1429. TRX held above $0.1234 until mid-May, then dropped to $0.1113, as per historical data.
- The price rebounded to $0.1398 in July but fell again to $0.1213 in early August, as supply and demand dynamics kept changing.
- By late September, TRX recovered to $0.166, reaching $0.1691 in October and touching $0.2130 in late November, as the price action remained in the upward direction. TRX ended 2024 with a price tag of $0.255.
- Tron was priced at $0.255 at the start of January 2025, and it was trading in a range of $0.204 to $0.257 in February, as the market trends kept flipping with decreasing market volatility.
- In March 2025, Tron (TRX) dipped to $0.212, but it recovered to the $0.23 range in April and $0.278 in May, while it observed its yearly high price of $0.370 on August 14. In October, Tron started its descent and fell below $0.30 by the end of the month.
- In December, Tron was trending below the $0.30 range, maintaining its price above $0.23.
- At the start of 2026, TRX was trading near $0.28, and in March, the token is trending near the same price range.
-
In April, Tron jumped to $0.31, and in May it increased to $0.37. However, in June, Tron decreased to the $0.33 range again, as the market conditions are not favorable.


 English (US)