
 2 months ago
9910
2 months ago
9910

The post Solana Price Slips Below $100 as ETF Stability Fails to Support Price: What Comes Next for SOL? appeared first on Coinpedia Fintech News
Solana price fell sharply in today’s session, sliding close to 7% and breaking below the $100 mark, a level that had acted as short-term psychological support. The move marks a clear technical breakdown, with price slipping out of its recent consolidation range as sellers maintained control throughout the session. The decline unfolded without a liquidation shock or ETF disruption, pointing instead to a demand-driven selloff. Spot market weakness, fading on-chain activity, and thinning liquidity combined to push SOL lower, raising questions over whether the market is entering a deeper corrective phase or simply resetting before the next attempt higher.
ETF Inflows Hold, But Solana Price Still Slips Lower
Solana’s ETF-linked exposure remained stable, but it failed to cushion the price as spot selling intensified. U.S. Solana spot ETFs posted a modest daily net inflow of $1.24 million, lifting cumulative inflows to $877.75 million, while total net assets hovered around $854.3 million, a level that has largely moved sideways in recent sessions.
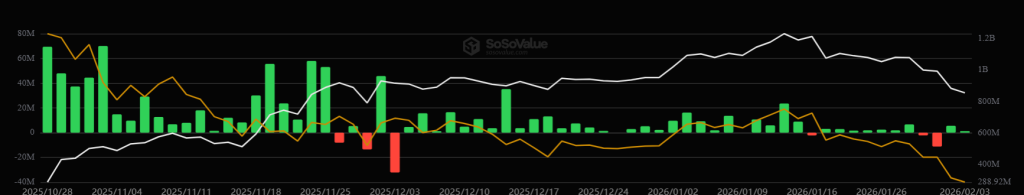
Beneath the surface, however, spot markets told a different story. Data shows net spot outflows nearing $29.9 million, coinciding with SOL’s breakdown below the $100 psychological level. This divergence proved critical. While ETFs neither saw aggressive redemptions nor meaningful dip buying, spot sellers dominated liquidity, leaving the market vulnerable once key support gave way. The result was a swift slide below the $100 mark, underscoring a familiar dynamic: ETF stability alone is not enough to support price when spot flows turn decisively negative.
On-Chain Data Shows TVL Decline as Capital Pulls Back
Solana’s on-chain metrics confirm that the latest price weakness is being accompanied by a measurable pullback in deployed capital. Network data shows Solana’s total value locked (TVL) has slipped by roughly 5–7% over the past week, easing from recent local highs as traders reduced exposure across DeFi protocols. While, the stablecoin market capitalization on Solana has also flattened, with balances holding near recent levels instead of expanding, a signal that fresh liquidity is no longer aggressively entering the ecosystem. Historically, periods where stablecoin supply stops growing tend to coincide with cooling momentum rather than trend acceleration.
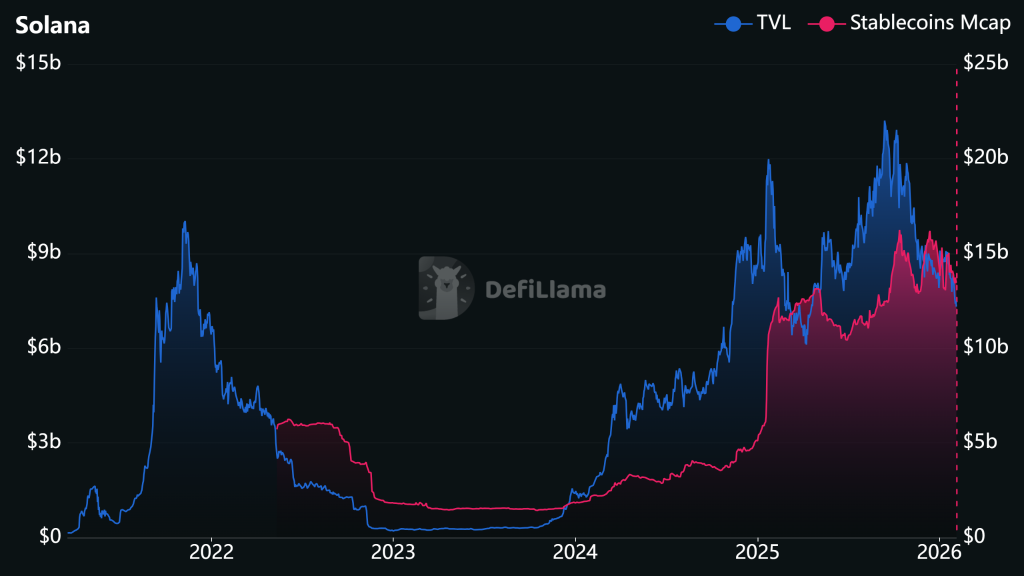
Transaction activity remains elevated compared to late 2025 averages, but growth has slowed noticeably from January’s peak levels. In parallel, wallet interaction data shows fewer large inflows, suggesting institutional and high-net-worth participants are waiting for clearer price confirmation before redeploying capital. Taken together, the numbers point to controlled capital rotation, not network stress. Solana’s on-chain health remains intact, but the contraction in TVL and stagnant stablecoin flows indicate that the network is in a risk-off consolidation phase, limiting upside pressure until liquidity conditions improve.
Solana Price Slips Below $100 as Structure Tilts Bearish
Solana’s sharp 7% daily drop confirms a structural failure below the $100 psychological level. Today’s drop pushed SOL decisively beneath this pivot, shifting short-term control back to sellers and exposing the lower end of the established range. SOL price has been trading inside a broad horizontal distribution, capped near $110–$115 and supported around $88–$92. The latest decline followed a lower high near $108, completing a classic range rejection pattern rather than a trend continuation setup. The breakdown below $100 is critical because it removes the midpoint support of this range, increasing the probability of a full rotation toward the lower boundary. The price action also shows SOL slipping below its rising mid-range trend guide, signaling momentum deterioration rather than healthy consolidation.
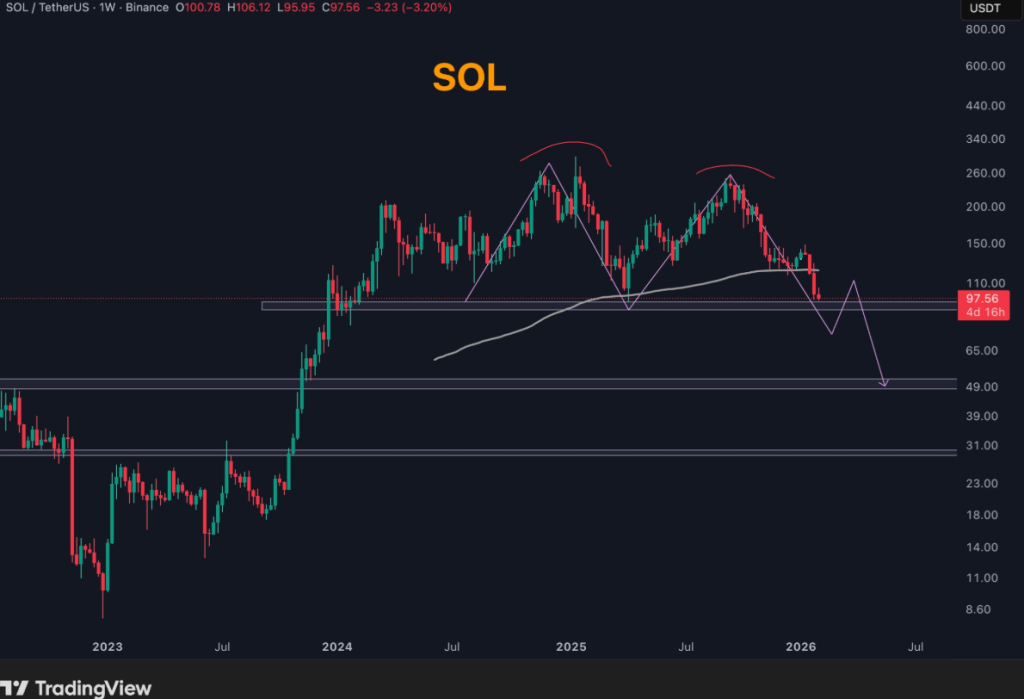
As long as price remains capped below $100–$102, upside attempts are likely to be corrective in nature, with sellers defending that zone aggressively. In this context, the $90–$92 area becomes the immediate level to watch, as it aligns with prior demand absorption and multiple historical reactions. A clean daily close below $88 would invalidate the current range and open downside risk toward $78–$80, where the next high-timeframe demand zone emerges. On the flip side, stabilization above $90 followed by a reclaim of $100 would signal that today’s sell-off was a liquidity sweep rather than a trend shift, allowing for a recovery move back toward $108–$110 though still within range, not a breakout.


 English (US)