
 3 months ago
12359
3 months ago
12359


The post SEI Price Jumps 10% Post Breakout: Can Bulls Push It Higher? appeared first on Coinpedia Fintech News
SEI has delivered a decisive move, rallying over 10% after breaking out of a prolonged downtrend. The shift comes after weeks of compressed price action where sellers maintained control through a series of lower highs. Momentum is now rotating as price structure, network activity, and derivatives data begin aligning. With the breakout confirmed and key resistance levels approaching, SEI price is entering a critical phase that could define its next directional move.
Network Activity Strengthens the Setup
SEI’s network activity shows steady improvement, reinforcing the recent price action. Total Value Locked (TVL) has climbed to $61.44 million, reflecting consistent capital inflows into the ecosystem. Stablecoin market cap on the network stands near $180.11 million, with a 0.94% weekly increase, indicating stable liquidity conditions. USDY dominance remains elevated at 59.43%, highlighting concentrated liquidity within the system.
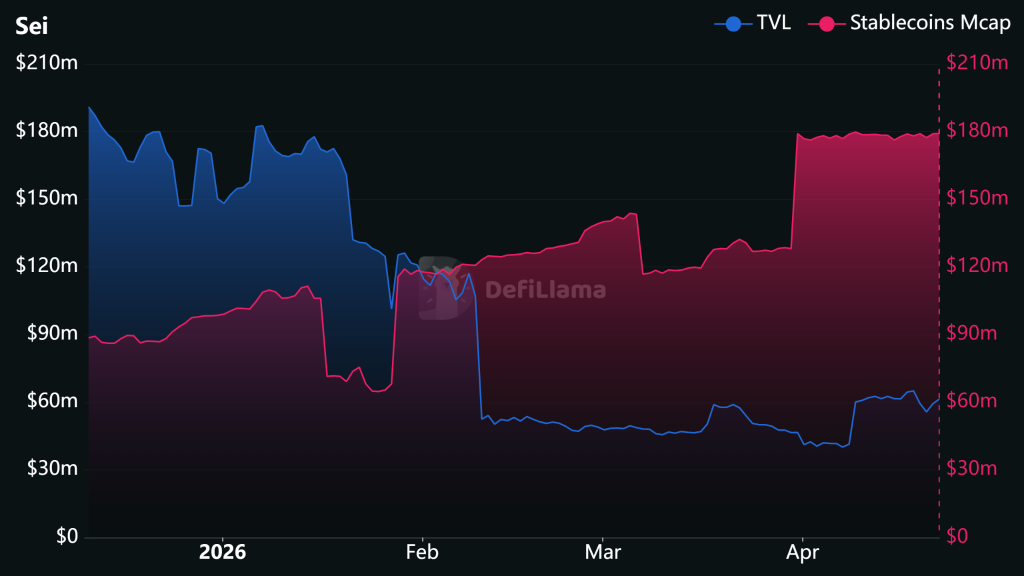
Daily inflows are approaching $922,835, while decentralized exchange volume is around $6.29 million, supported by perpetual volume of $22.68 million. The data suggests sustained activity rather than a short-lived spike.
SEI Price Structure Signals Early Trend Reversal
SEI has broken out of its falling channel, ending a multi-week downtrend that kept price locked in a sequence of lower highs. SEI price is currently trading near $0.061–$0.062, rebounding from recent lows around $0.055. The breakout confirms a structural shift as price moves above the descending resistance, signaling that bearish control is weakening. The 20 EMA has flipped below price, indicating that short-term momentum is now favoring buyers.
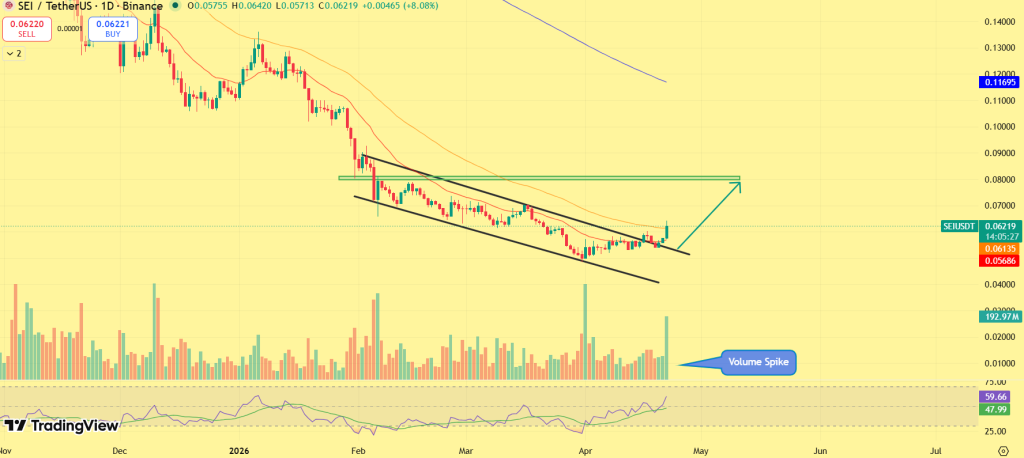
With a clear volume spike visible during the breakout, it confirms a strong participation and reduces the probability of a false breakout. RSI has recovered toward the 58–60 range, showing improving strength while still leaving room for continuation. The structure now suggests the formation of a higher low, replacing the previous downtrend behavior and signaling the early phase of a potential trend reversal.
Key Levels to Watch
SEI is now testing a key resistance band between $0.065 and $0.070, a zone that previously acted as supply and capped upside attempts. A sustained move above this range could open the path toward $0.085–$0.090, aligning with prior breakdown levels.
On the downside, the breakout zone between $0.055 and $0.058 becomes the critical support area. Holding this range is essential to maintain bullish structure and confirm continuation.
Derivatives Data Signals Growing Participation
Derivatives data is reinforcing the strength of the move. Trading volume has surged to approximately $112.32 million, marking a 96.77% increase, while open interest has climbed to around $66.15 million, up 29.35%.
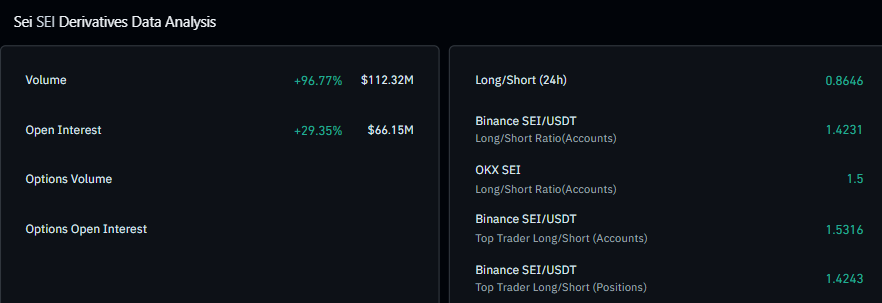
This rise in both volume and open interest indicates that new positions are entering the market, supporting the breakout rather than reflecting short-term covering. Funding rates remain relatively balanced, suggesting the rally is not overcrowded and still has room to expand. The current setup places SEI at a key inflection point where continuation could evolve into a broader recovery trend.


 English (US)