
 3 months ago
6460
3 months ago
6460

Key takeaways
- In 2025, Polkadot might reach a maximum price value of $8.8 and an average value of $3.6.
- In 2028, the DOT price can reach a maximum of $16.26 and a minimum of $13.05.
- The price of Polkadot is predicted to reach a maximum value of $30.04 in 2031.
Polkadot (DOT) has shown impressive growth and resilience in a volatile cryptocurrency market, supported by its strong multichain protocol architecture and investor confidence. A major contributor to this success is the Sinai Upgrade on its Acala Network, enhancing functionality and security.
With over 32 million transactions validated in October 2024 by the Polkadot Relay Chain, the network demonstrates significant activity and utility. A notable increase in unique wallets further signals growing user adoption and engagement, strengthening Polkadot’s position as a leading blockchain platform. Will DOT reach new heights soon? Let’s get into the Polkadot price prediction for 2025-2031.
Overview
| Cryptocurrency | Polkadot |
| Token | DOT |
| Price | $3.79 (-2.9%) |
| Market Cap | $6.32B |
| Trading Volume | $156.75M |
| Circulating Supply | 1.58B DOT |
| All-time High | $55.00 Nov 4, 2021 |
| All-time Low | $2.69 Aug 19, 2020 |
| 24-hour High | $4.12 |
| 24-hour Low | $3.98 |
Polkadot price prediction: Technical analysis
| Volatility | 7.77% |
| 50-Day SMA | $4.42 |
| 14-Day RSI | 48.45 |
| Sentiment | Bearish |
| Fear & Greed Index | 57 (Greed) |
| Green Days | 13/30 (43%) |
| 200-Day SMA | $4.54 |
Polkadot DOT price analysis: DOT trades at $3.79 as bearish pressure intensifies
- Resistance holds, DOT keeps getting rejected at $3.99, showing intense sell pressure at that level.
- Downtrend continues, and lower highs and lows confirm a bearish market structure.
- Sellers in Control of intraday moves are driven by selling, with little buyer interest near support.
Polkadot (DOT) on 17th June is currently priced at $3.79, down 2.92% in the last 24 hours. The asset is now sitting at its intraday support level of $3.79, while the immediate resistance lies at $3.99. DOT began the day with mild upward movement but faced persistent rejection before noon, triggering a strong downward trajectory. The short-term chart shows consistent bearish dominance despite a brief period of stability.
DOT remains significantly below its all-time high of $55.00 reached on November 4, 2021, registering a 93.08% decline. It still holds a 41.27% gain from its all-time low of $2.69 recorded on August 20, 2020. The price drop reflects broader weakness in the crypto sector and declining investor confidence. Intraday trading has leaned heavily toward selling activity, showing little sign of reversal so far.
Polkadot daily price chart: DOT sellers retake control
The 1-day chart shows Polkadot facing clear bearish pressure. After briefly touching $3.99, the token failed to maintain upward momentum and fell back to support at $3.79. This marks a repeated rejection at resistance, with each subsequent high falling short of the previous one. The chart pattern is forming a descending trajectory, which typically signals growing selling strength.
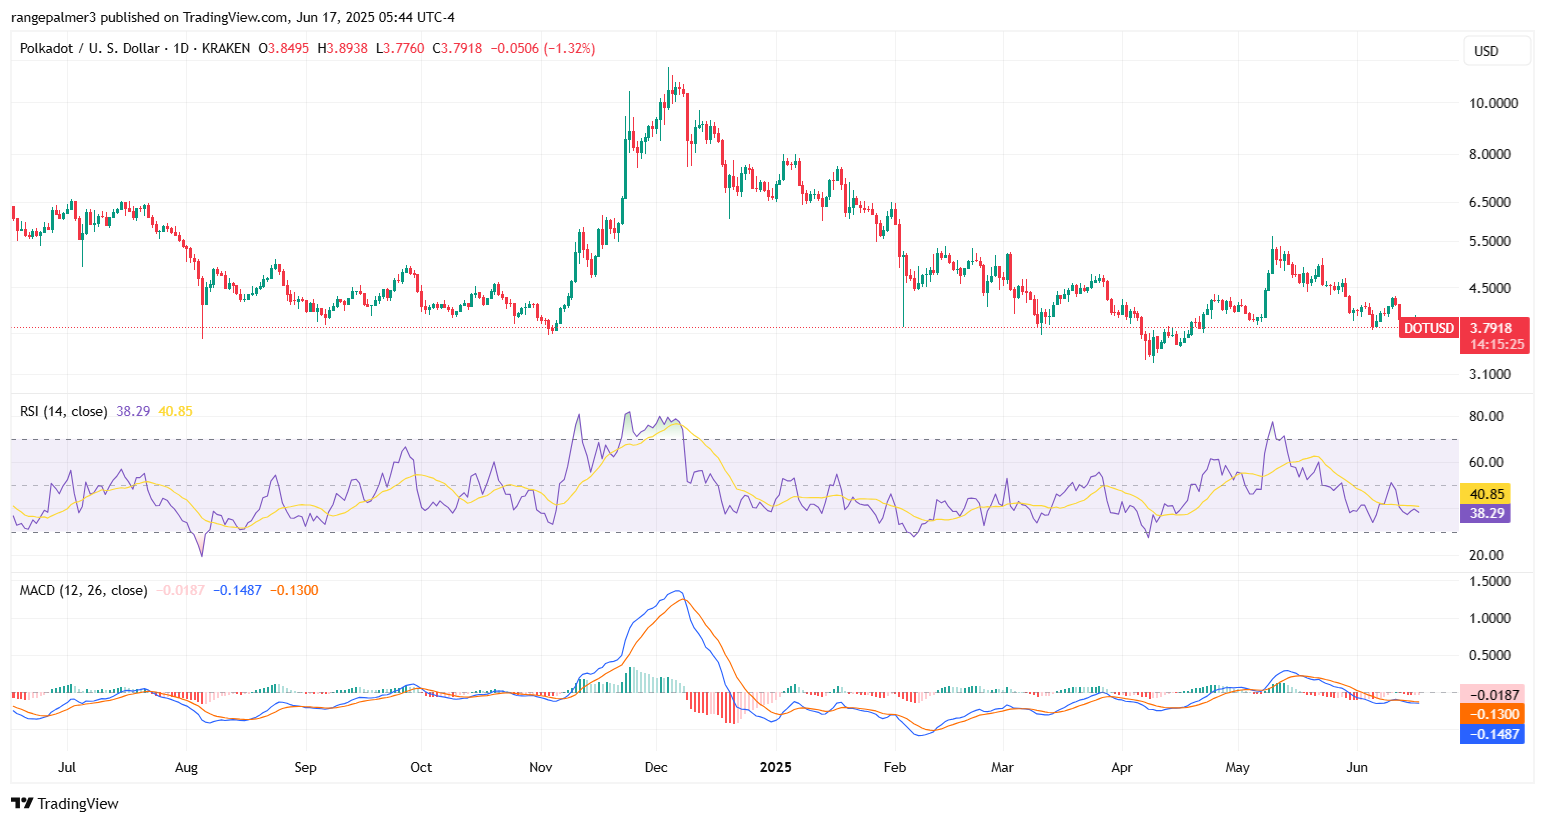 DOT/USDT Price Chart
The Relative Strength Index (RSI) is sitting below 45, showing a lack of bullish momentum. DOT is trading well under both the 50-day and 200-day moving averages, which confirms a bearish market structure. If DOT loses the $3.79 support, the next critical area is around $3.65. For bulls to regain control, a sustained move above $3.90 backed by volume would be required.
Polkadot 4-Hour Price Chart: DOT short-term trend turns down
On the 4-hour chart, DOT experienced a sharp rejection from $3.99 late in the previous session. After hovering near the top for a few hours, the price broke lower with a strong red candle, pushing back to the $3.79 support level. The short-term structure has shifted toward lower highs and lower lows, suggesting momentum is currently with the bears.
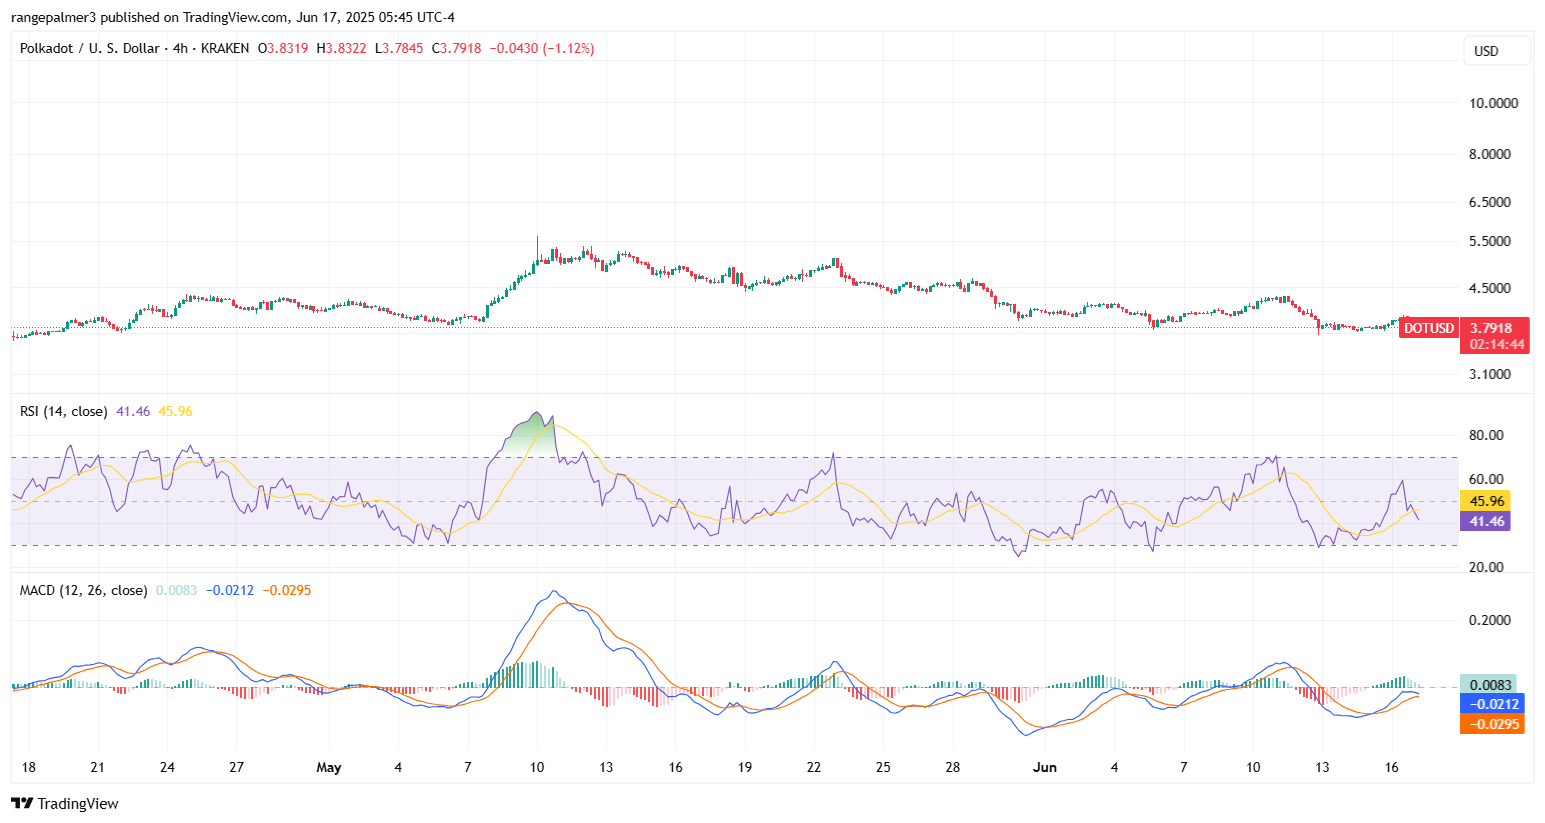 DOT/USDT Price Chart
MACD indicators show a fresh bearish crossover on the 4-hour timeframe, reinforcing downside potential. Volume has also been concentrated during the downward moves, confirming active selling. If this pattern continues, traders may look for $3.75 as a near-term support. A move back above $3.85 with substantial volume would be needed to rechallenge the $3.99 resistance.
Polkadot technical indicators: Levels and action
Daily simple moving average (SMA)
| Period | Value ($) | Action |
| SMA 3 | $4.13 | SELL |
| SMA 5 | $4.22 | SELL |
| SMA 10 | $4.14 | SELL |
| SMA 21 | $4.31 | SELL |
| SMA 50 | $4.42 | SELL |
| SMA 100 | $4.29 | SELL |
| SMA 200 | $4.54 | SELL |
Daily exponential moving average (EMA)
| Period | Value ($) | Action |
| EMA 3 | $4.27 | SELL |
| EMA 5 | $4.25 | SELL |
| EMA 10 | $4.18 | SELL |
| EMA 21 | $4.18 | SELL |
| EMA 50 | $4.43 | SELL |
| EMA 100 | $4.92 | SELL |
| EMA 200 | $5.38 | SELL |
What to expect next?
Polkadot’s immediate outlook remains bearish unless a significant change in buying volume appears. With $3.79 acting as the current floor, any breach below this level could trigger further declines toward $3.75 or even $3.65 in the short term. Sellers continue to dominate as DOT fails to attract strong demand near key technical levels.
On the flip side, any sustained price action above $3.85 could open the door for a retest of the $3.99 resistance zone. However, the bulls would need to overcome multiple technical hurdles, including reclaiming the moving average lines and pushing the RSI back above the neutral 50 mark. Until then, sentiment is expected to remain cautious, with traders closely monitoring volume spikes and broader market cues for a potential trend reversal.
Is Polkadot a good investment?
Polkadot remains a strong long-term project due to its unique multichain architecture and active developer ecosystem. Its role in enabling blockchain interoperability continues to attract attention in the Web3 space.
However, with DOT down 93.08% from its all-time high, current sentiment is clearly bearish. The price remains under pressure, and short-term outlooks suggest limited upside unless key resistance levels are broken. DOT may offer long-term potential, but near-term investment requires caution and close technical monitoring.
Why is Polkadot down today?
Polkadot is down 2.92% on June 17, trading at $3.79, mainly due to strong intraday selling pressure and weak overall market sentiment. After an early attempt to push higher, DOT faced consistent rejection near $3.99, leading to a sharp decline back to support.
Technical indicators show a lack of bullish momentum, with DOT trading below key moving averages and the RSI under 45. This suggests that traders are exiting positions or avoiding new entries. Broader uncertainty in the crypto market and lack of buyer conviction are also contributing to the downward movement.
Will Polkadot recover?
Polkadot (DOT) shows signs of recovery with a recent upward trend. If favorable market conditions continue, we could see a bullish trend, and Polkadot has the potential to recover.
Recent news on Polkadot
- Chainspect announced an integration with the Polkadot ecosystem, allowing users to view real-time metrics of the Polkadot Relay Chain and its parachains.
Will Polkadot reach $10?
Yes, according to the long-term predictions, Polkadot is projected to reach up to $10 by 2027.
Will Polkadot reach $100?
Reaching $100 for Polkadot (DOT) is highly ambitious and unlikely in the near term.
Does Polkadot have a promising long-term future?
Based on Polkadot’s ongoing buying demand and positive community support, the DOT price is set to make new highs in the coming years. However, you are advised to do your research before investing in the volatile market.
Polkadot price prediction June 2025
Here are the current Polkadot price movements in June 2025. The potential low is $3.7, while the current price might average around $4.1. On the higher end, DOT could reach up to $4.3.
| Month | Potential Low | Potential Average | Potential High |
| June | $3.7 | $4.1 | $4.3 |
Polkadot price prediction 2025
DOT price prediction in 2025 expects DOT to have a minimum value of $3.60 and a maximum value of $8.80. The token price and the coin’s average value could be around $8.26.
| Polkadot Price Prediction | Potential Low | Potential Average | Potential High |
| 2025 | $3.60 | $8.26 | $8.80 |
Polkadot Price Predictions 2026-2031
| Year | Minimum Price | Average Price | Maximum Price |
| 2026 | $8.61 | $9.46 | $10.24 |
| 2027 | $11.76 | $13.80 | $14.49 |
| 2028 | $13.05 | $14.41 | $16.26 |
| 2029 | $15.41 | $17.70 | $18.26 |
| 2030 | $19.02 | $21.28 | $21.49 |
| 2031 | $27.04 | $28.01 | $30.04 |
Polkadot price prediction 2026
According to the Polkadot prediction for 2026, DOT could reach a maximum price of $10.24, with the lowest price expected to be $8.61 in 2025, and an average forecast price of $9.46.
Polkadot price prediction 2027
The price of Polkadot is predicted to reach a minimum value of $11.76 in 2027. Per expert analysis, DOT tokens could reach a maximum value of $14.49 and an average trading price of $13.80.
Polkadot price prediction 2028
Polkadot predicts that in 2028, the Polkadot network will reach a minimum price level of $13.05, a maximum price of $16.26, and an average trading price of $14.41.
Polkadot price prediction 2029
The price of Polkadot is predicted to reach a minimum value of $15.41 in 2029. Traders can anticipate a maximum value of $18.26 while monitoring key support levels and an average trading price of $17.70.
Polkadot price prediction 2030
According to the Polkadot price prediction for 2030, DOT could reach a maximum price of $21.49, a minimum price of $19.02, and an average forecast price of $21.28.
Polkadot price prediction 2031
In 2031, Polkadot’s price is predicted to reach a minimum level of $27.04. Should positive market sentiment persist, DOT can attain a maximum cost of $30.04 and an average trading price of $28.02.
 Polkadot Price Prediction 2025-2031
Polkadot market price prediction: Analysts’ DOT price forecast
| Firm | 2025 | 2026 |
| DigitalCoinPrice | $8.76 | $10.20 |
| Coincodex | $6.84 | $8.36 |
Cryptopolitan’s Polkadot (DOT) Price Prediction
The DOT price prediction for 2025 expects DOT to have a minimum value of $2.5 and a maximum value of $5.91. The token price and the coin’s average value could be around $5.30. By the end of 2031, we expect the DOT price to reach a maximum level of $61.24.
Polkadot historic price sentiment
- After spending most of the second half of 2020 trading around $4-$5, the price broke above the previous all-time high of $7 on December 29 and quickly reached the Polkadot price projection of $10.
 Polkadot price history | Coinmarketcap
- Polkadot experienced rapid growth, with its price climbing from around $3 in January to an all-time high of approximately $57.50 in May 2021.
- After the peak, the price declined sharply, falling to around $10 by July before partially recovering to over $40 in November 2021.
- In 2022, Polkadot price steadily declined, starting the year around $30 and dropping below $10 by mid-year.
- By the end of 2022, the price stabilized near $5 as bearish market conditions dominated the cryptocurrency space.
- The price of DOT hovered between $5 and $7 for most of 2023, reflecting a period of consolidation and limited market excitement.
- In January 2024, Polkadot’s price remained relatively stable, trading around the $5–$6 range.
- By July 2024, Polkadot showed slight signs of recovery, with its price rising to around $7–$8. This modest uptick was likely driven by increasing market interest.
- In December 2024, Polkadot showed signs of recovery, with its price climbing to around $10.4.
- In January 2025, Polkadot peaked at $7.98 but lost momentum towards the end of the month, leading to a trading range of $4.64 – $5.28 in February.
- In March, 2025, Polkadot (DOT) traded at approximately $4.30.
- In April 2025, Polkadot (DOT) experienced a gradual downtrend, with its price hovering slightly below the $4 mark amid ongoing market volatility.
- In May, Polkadot (DOT) began trading at around $4.1 and showed moderate fluctuations. As of the latest update, the price has declined slightly and is hovering near $3.9, reflecting a mild bearish trend so far.


 English (US)