
 3 months ago
18305
3 months ago
18305

Key Takeaways:
- Our Ordinals price prediction anticipates a high of $5.10 in 2026.
- In 2028, it will range between $9.14 and $10.97, with an average price of $9.46.
- In 2030, it will range between $18.49 and $22.35, with an average price of $19.03.
In 2023, ORDI became the first BRC-20 token to breach $1 billion in market capitalization. Following this achievement, ORDI gained attention from DeFi enthusiasts for its role in innovation. The Ordinals protocol allows data to be embedded directly on Bitcoin’s smallest unit—the Satoshi.
ORDI was the first token inscribed on the Ordinals protocol; like Bitcoin, it has a maximum supply of 21,000,000 coins. Currently trading at the $8 mark, investors can’t help but speculate on Ordi’s price trajectory. How high will ORDI go? Can ORDI surge 100x? What will the price of ORDI be in 2030? Let’s explore the ORDI price prediction from 2026 to 2032.
Overview
| Cryptocurrency | Ordinals |
| Symbol | ORDI |
| Current price | $2.39 |
| Market cap | $50.19M |
| 24-hour trading volume | $11.13M |
| Circulating supply | 21M |
| All-time high | $96.17 on Mar 5, 2024 |
| All-time low | $1.41 on Oct 11, 2025 |
| 24-hour high | $2.45 |
| 24-hour low | $2.31 |
ORDI price prediction: Technical analysis
| Metric | Value |
| Volatility (30-day variation) | 5.61% (High) |
| 50-day SMA | $2.50 |
| 200-day SMA | $5.04 |
| Sentiment | Bearish |
| Green days | 14/30 (47%) |
| Fear and Greed Index | 13 (Extreme Fear) |
ORDI price analysis
On Apr 6, 2026, ORDI’s price rose by 2.89% over the last 24h and 0.51% over the last 30 days. Its trading volume fell by 23.67% in the last 24 hours, indicating low trader interest.
ORDI/USD 1-day chart
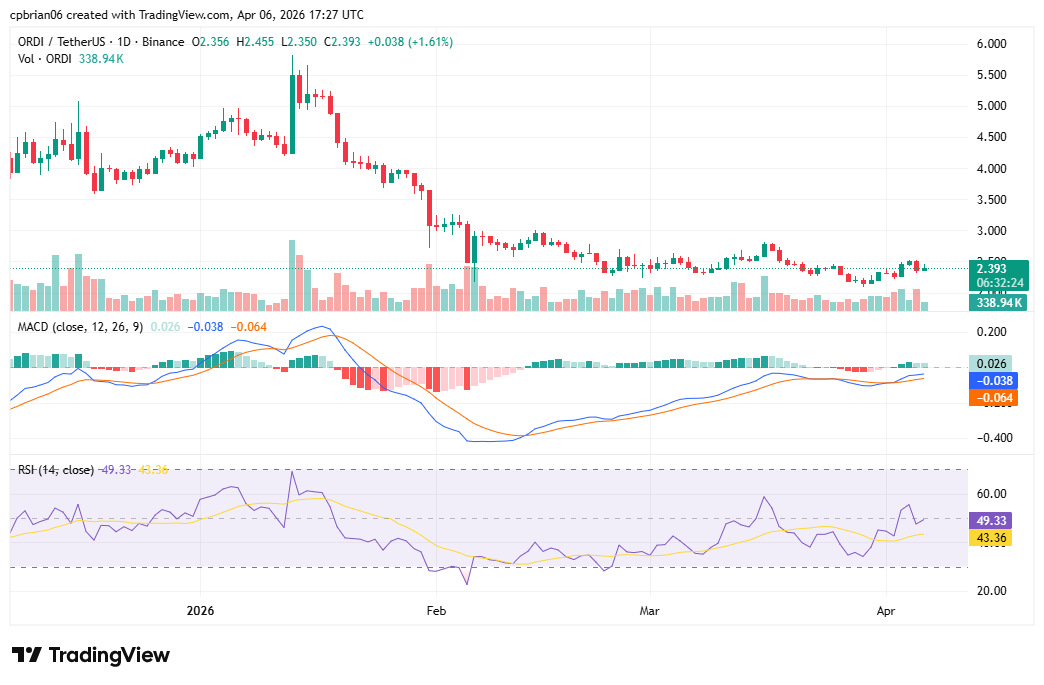 ORDIUSD chart by TradingView
The RSI level of 49.33 indicates Ordi is in the neutral region. It is oversold when the value drops below 30. The MACD histograms indicate slowing momentum. Ordi is now trading along support levels at $2.25. Sustained momentum below current support could force ORDI to sub $2.00 levels.
ORDI/USD 4-hour chart
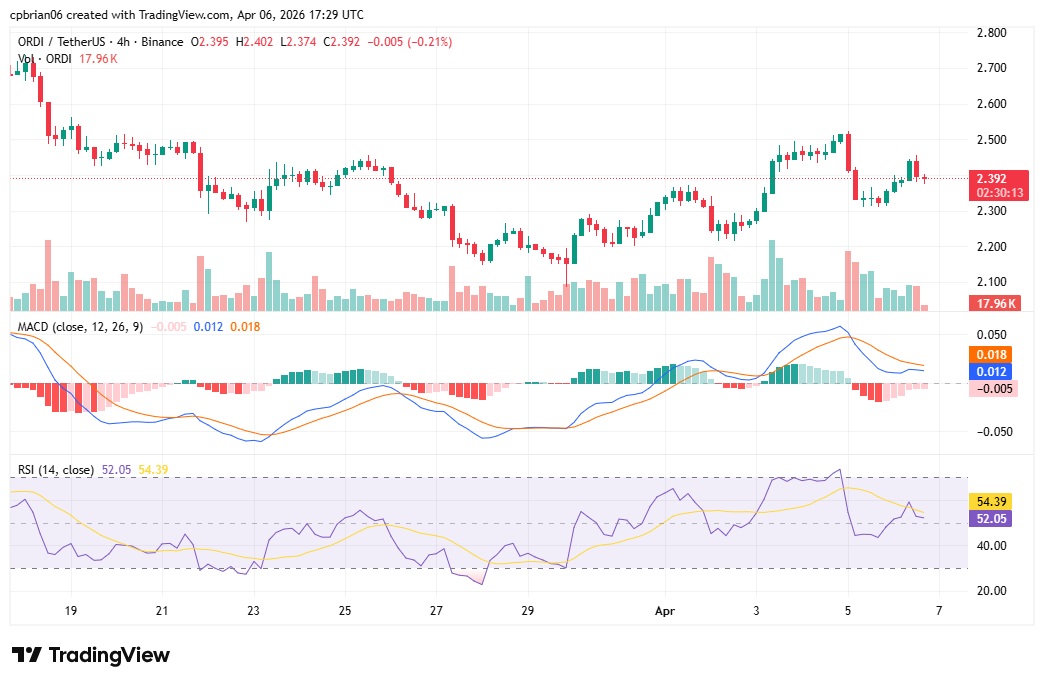 ORDIUSD chart by TradingView
The 4-hour chart shows ORDI is recovering from its lowest level this month. Ordi’s negative momentum is slowing, pushing towards immediate resistance levels at $2.52. The RSI is in neutral territory at 52.05.
ORDI technical indicators: Levels and action
Daily simple moving average (SMA)
| Period | Value ($) | Action |
| SMA 3 | 3.28 | SELL |
| SMA 5 | 2.85 | SELL |
| SMA 10 | 2.45 | SELL |
| SMA 21 | 2.42 | SELL |
| SMA 50 | 2.50 | SELL |
| SMA 100 | 3.29 | SELL |
| SMA 200 | 5.04 | SELL |
Daily exponential moving average (EMA)
| Period | Value ($) | Action |
| EMA 3 | 2.43 | SELL |
| EMA 5 | 2.60 | SELL |
| EMA 10 | 3.04 | SELL |
| EMA 21 | 3.52 | SELL |
| EMA 50 | 4.01 | SELL |
| EMA 100 | 4.82 | SELL |
| EMA 200 | 6.77 | SELL |
What to expect from ORDI price analysis next?
The recent rise is a correction of Ordi’s month-long bear run. The coin is moving along support at $2.25.
Why is ORDI up?
ORDI’s gains closely mirror Bitcoin’s over the same period, indicating a strong beta correlation. Bitcoin’s move was powered by two key factors: steady U.S. spot Bitcoin ETF inflows, which saw a net positive week, and a massive $99.1 million short liquidation on Hyperliquid after a whale bet against BTC.
Is ORDI a good investment?
ORDI had the first-mover advantage on the Ordinals protocol. ORDI, like Bitcoin, has a capped supply of 21 million coins and should therefore become scarcer over time. Our Cryptopolitan Price Prediction indicates how the coin’s value will increase in the years to come.
Recent news
Macro-driven market decline. Geopolitical risk from airstrikes on Gulf energy infrastructure sparked a flight from risk assets, pulling down Bitcoin and altcoins like ORDI.
Ordinals price prediction April 2026
The Ordinals forecast for April is a maximum price of $2.82 and a minimum price of $1.90. The average trading price will be $2.32.
| Month | Potential low ($) | Potential average ($) | Potential high ($) |
| April | 1.90 | 2.32 | 2.82 |
Ordinals price prediction 2026
For the remainder of 2026, ORDI’s price will range between $1.80 and $5.10. The average price for the year will be $2.10.
| Year | Potential low ($) | Potential average ($) | Potential high ($) |
| 2026 | 1.80 | 2.10 | 5.10 |
Ordinals price prediction 2027 – 2031
| Year | Potential low ($) | Potential average ($) | Potential high ($) |
| 2027 | 6.33 | 6.51 | 7.65 |
| 2028 | 9.14 | 9.46 | 10.97 |
| 2029 | 13.01 | 13.48 | 15.77 |
| 2030 | 18.49 | 19.03 | 22.35 |
| 2031 | 27.15 | 27.91 | 32.07 |
| 2032 | 37.51 | 38.63 | 45.84 |
Ordinals ORDI price prediction 2027
Ordinal coin price prediction continues to climb even higher into 2027. According to predictions, ORDI’s price will range from $6.33 to $7.65, with an average price of $6.51.
Ordinals crypto price prediction 2028
Our analysis indicates a further acceleration in ORDI’s price. It will trade between $9.14 and $10.97, averaging $9.46.
Ordinals ORDI price prediction 2029
According to the ORDI sats price prediction for 2029, ORDI’s price is expected to range between $13.01 and $15.77, with an average of $13.48.
Ordinals price prediction 2030
According to the 2030 Ordinals price prediction, the price is expected to range between $18.49 and $22.35, with an average price of $19.03.
Ordinals price prediction 2031
The highest price for 2031 is $32.07. It will reach a minimum price of $27.15 and an average price of $27.91.
Ordinals price prediction 2032
The Ordinals ORDI price prediction ranges from $37.51 to $45.84, with an average price of $38.63.
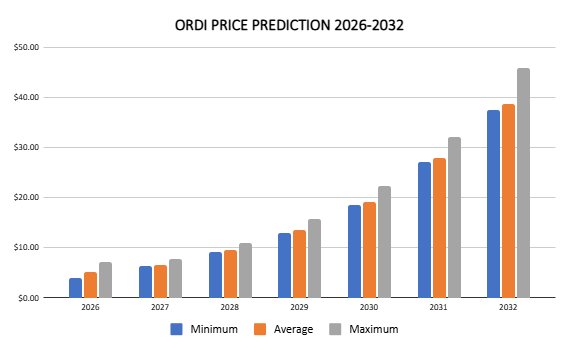 ORDI price prediction 2026 – 2032
Ordinals market price prediction: Analysts’ ORDI price forecast
| Platform | 2026 | 2027 | 2028 |
| Coincodex | $1.94 | $4.27 | $2.70 |
| Gate.com | $2.38 | $2.47 | $2.71 |
Cryptopolitan Ordinals price prediction
Our predictions indicate that ORDI will achieve a high of $5.10 in 2026. In 2028, it will range between $9.14 and $10.97, with an average of $9.46. In 2030, it will range between $18.49 and $22.35, with an average of $19.03. Note that the predictions are not investment advice. Seek independent consultation or do your research.
ORDI’s historic price sentiment
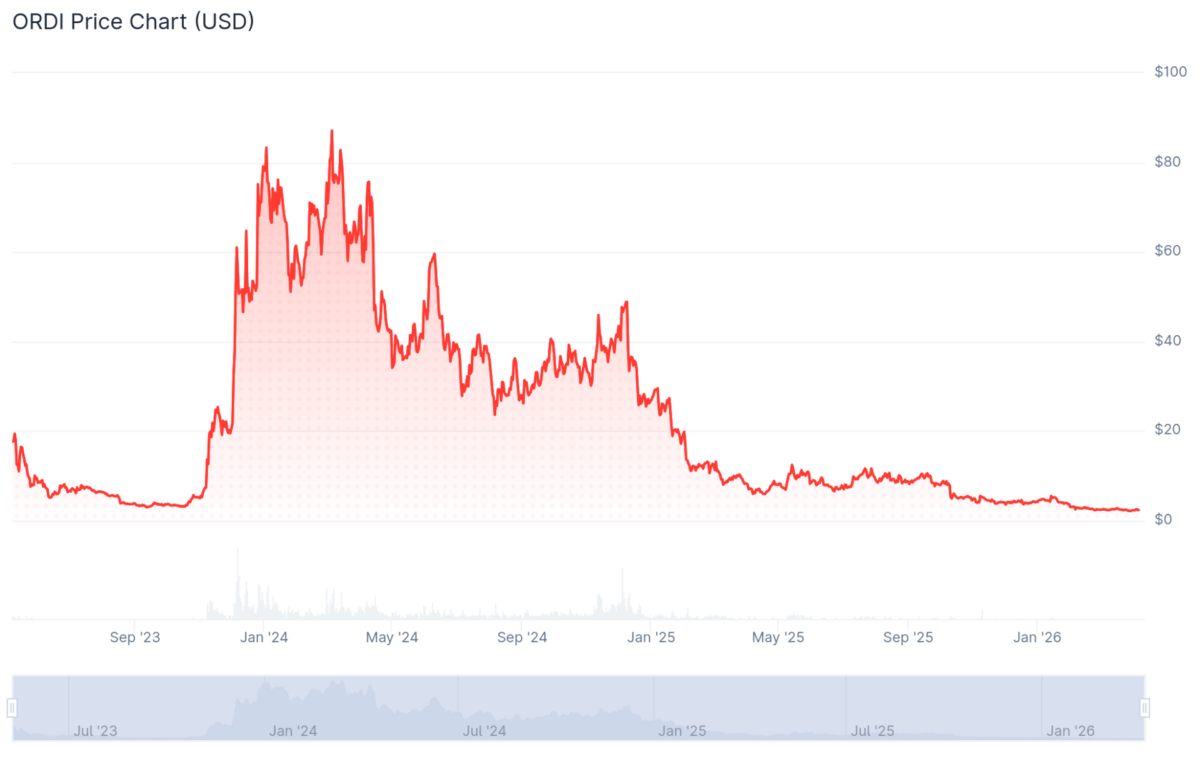 ORDI price history by CoinGecko
- According to CoinMarketCap, ORDI started trading in May 2023 at $25.3466. It later fell to its lowest level of $2.86 in September 2023.
- Binance listed ORDI on November 17, 2023. However, due to insufficient clarity from Binance, many mistakenly believed that ORDI was a direct product of the Ordinals protocol.
- This misunderstanding contributed to ORDI’s dramatic market performance. The meme coin saw a 40% increase in value within a single day, culminating in a 100% rise over four days.
- Despite these fluctuations, ORDI’s popularity surged, and by the end of 2023, its price had climbed above $50.
- ORDI peaked in March 2024 at $96.17, an all-time high.
- It later moved into a bear run, and by April, it had already dropped by 50%. It started recovering in November, rising above the $35 mark and $48 in December.
- In 2025, the trend quickly reversed, falling below $12 in February and $8 in May. In July, it was trading below $10. In October, it dropped $8 and assumed a bearish run; by December, it had reached $3.80.
- In 2026, it fell below $3.00. In March, it dropped below $2.50.


 English (US)