

Dogecoin is ending the first week of 2026 parked on a cluster of long-watched supports, and three chart-focused analysts are converging on the same question: is this the higher low that starts a broader bottoming process, or just another pause inside a larger corrective leg?
The Yearly Dogecoin Chart
On the yearly view, Cantonese Cat’s chart frames 2025 as a hold of the 0.786 log Fibonacci support at roughly $0.10879, with the market printing an inside candle into year-end. In that construction, the key takeaway is not momentum but structure: price respected a major retracement line on a log scale and stayed boxed inside the prior year’s range: “DOGE ended 2025 holding 0.786 log fib as support, forming an inside candle, favors bullish continuation,” the analyst writes.
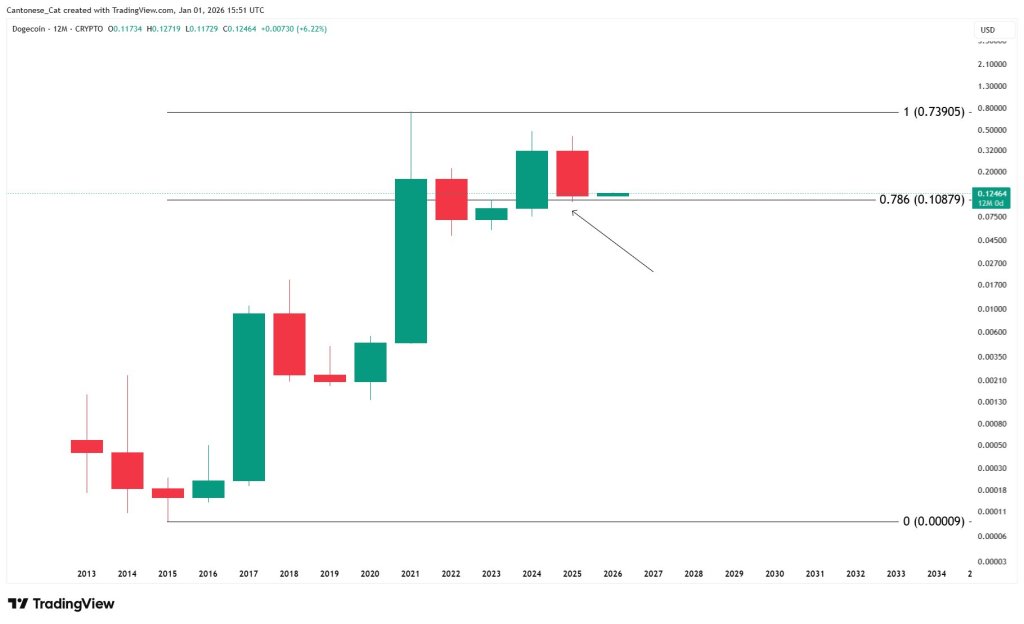
The same yearly chart also contextualizes what “continuation” on the yearly view means: the next major reference level is the 1.0 fib line up near $0.73905. That is not being presented as an imminent target, but it does underscore why analysts care about this zone, if the 0.786 level holds on higher timeframes, the chart’s mapped upside is structurally open, even if the path is not linear.
The Monthly DOGE Chart
Matt Hughes aka “The Great Mattsby’s” monthly chart tightens the focus to a single, precise level: the 0.382 Fibonacci retracement at $0.11778. Price is shown holding that line while carving out what the chart labels as a higher low, and the analyst is explicit about what that would mean in market-structure terms.
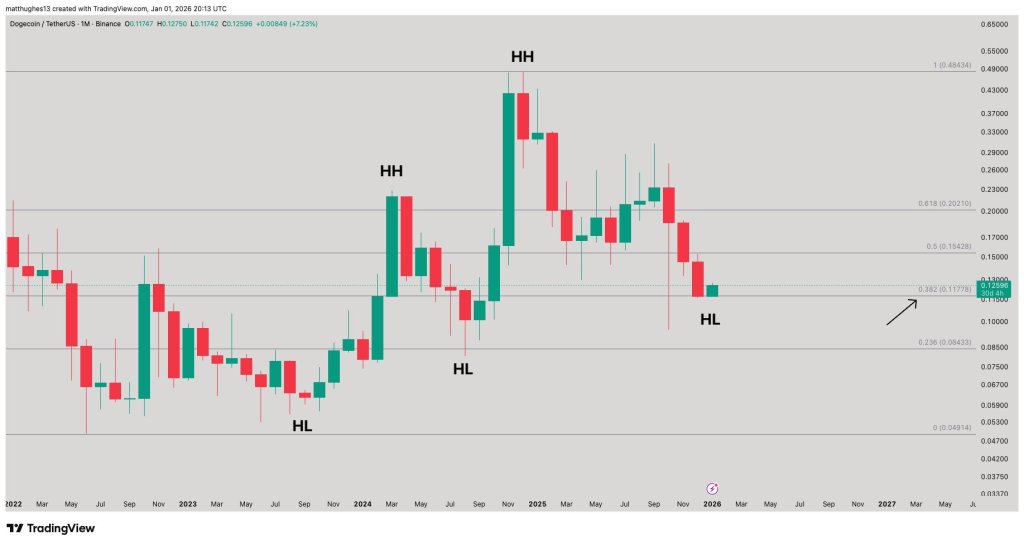
“To me, this looks like the higher low needed to start the bottoming process, especially with price holding the 0.382 Fib retracement at 0.11778,” Mattsby wrote, adding that he views the “.11–.12 zone” as compelling on a risk/reward basis. In this framing, the thesis is conditional: the market is not “bullish” because it bounced, it’s constructive because it is attempting to stop making lower lows while defending a defined retracement.
If that $0.11778 level gives way on a monthly basis, the same fib ladder shown on the chart highlights lower references beneath it, including the 0.236 retracement around $0.08433. On the upside, the next retracement markers visible are $0.15428 (0.5) and $0.20210 (0.618), which would be the nearby “prove it” areas if this is, in fact, a basing process rather than a dead-cat bounce.
The Weekly Dogecoin Chart
Kevin (Kev_Capital_TA) shifts the emphasis to the weekly. Via X, he posted: “Still early but Dogecoin is currently printing a really nice weekly reversal demand candle within a major demand zone.”
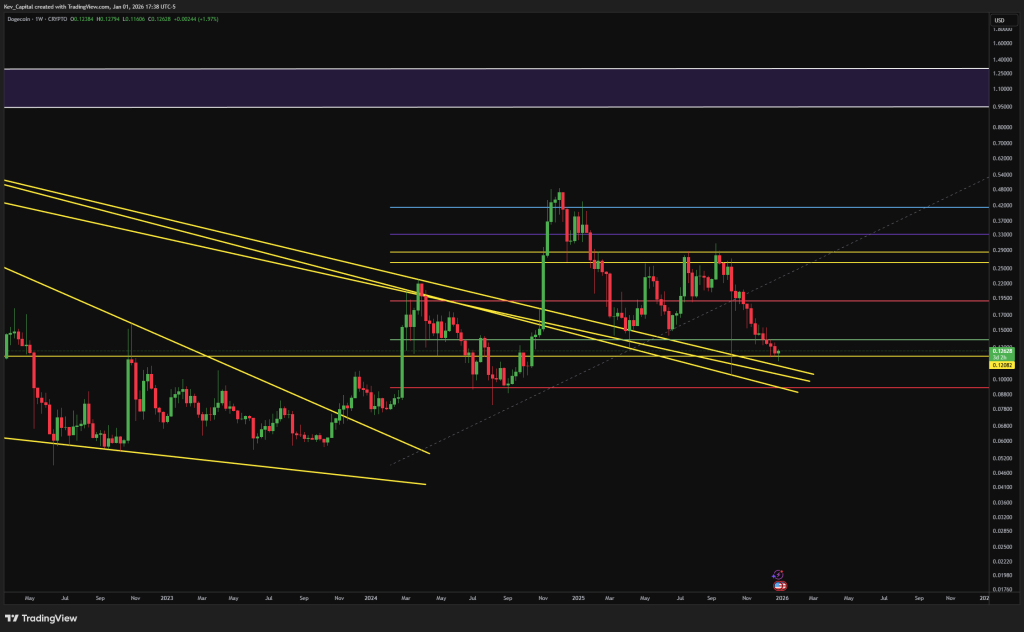
His conditions are tight and time-bound: “If you can confirm that weekly candle by Sunday close, reclaim the 4HR 200 sma/ema on both Doge and BTC then you could see the low put in for this major correctional phase and the counter trend move higher occuring. All eyes on 88K-91K on BTC.”
For Dogecoin traders, the immediate calls are straightforward: Dogecoin needs to keep defending the $0.11–$0.12 area, while the weekly close either validates or negates Kevin’s reversal-candle thesis.
If price loses the $0.11778 monthly retracement, the “bottoming” narrative weakens quickly; if it holds and begins reclaiming nearby resistance levels, the charts collectively argue the market may be transitioning from correction to base-building, one confirmed close at a time.
At press time, DOGE traded at $0.13242.


 English (US)