
 2 months ago
10223
2 months ago
10223

As Ethereum (ETH) attempts to recover from the recent crash, the Ethereum Rainbow Chart has offered a glimpse of how the asset might trade at the end of this month.
Notably, the chart overlays ETH’s historical price action on logarithmic growth curves and segments future valuations into color-coded sentiment bands, ranging from extreme overvaluation to deep undervaluation.
Ethereum has since reclaimed the $2,000 support zone, with the cryptocurrency trading at $2,009 as of press time, up over 4% in the past 24 hours. However, on the weekly chart, the asset remains in the red, down more than 13%.
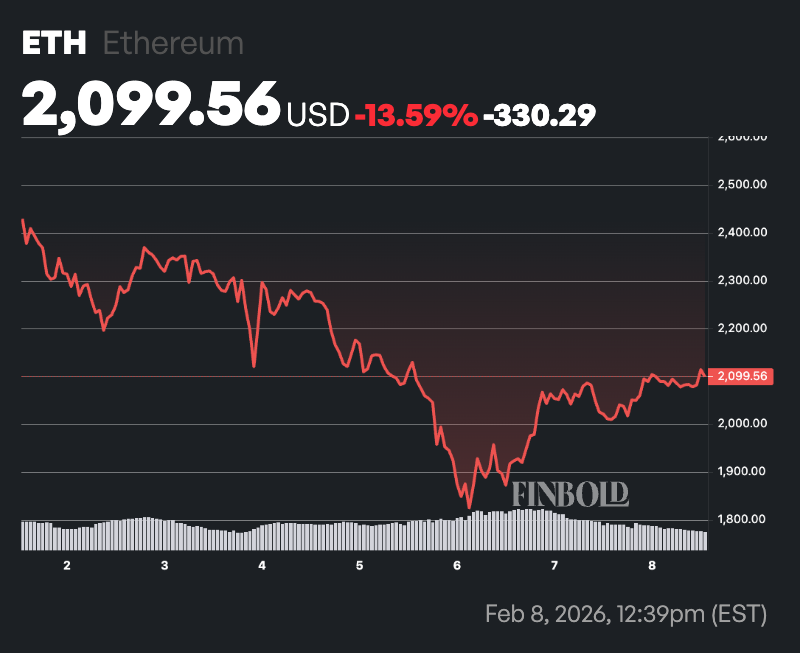 ETH seven-day price chart. Source: Finbold
ETH price prediction
Based on the chart’s February 28, 2026, reading, Ethereum could trade anywhere between roughly $1,011 and $22,767, depending on market conditions.
At the top end, the ‘Maximum Bubble Territory’ band spans $15,999.66 to $22,766.71, signaling extreme speculative excess and historically elevated correction risk. Just below it, the ‘But have we ‘earned it? band, ranging from $11,209.24 to $15,999.66, reflects aggressive upside where price growth may be running ahead of fundamentals.
The next zone, Is this the ‘Flippening?’, sits between $7,723.72 and $11,209.24 and represents a strong bull-market phase often associated with Ethereum significantly outperforming the broader crypto market.
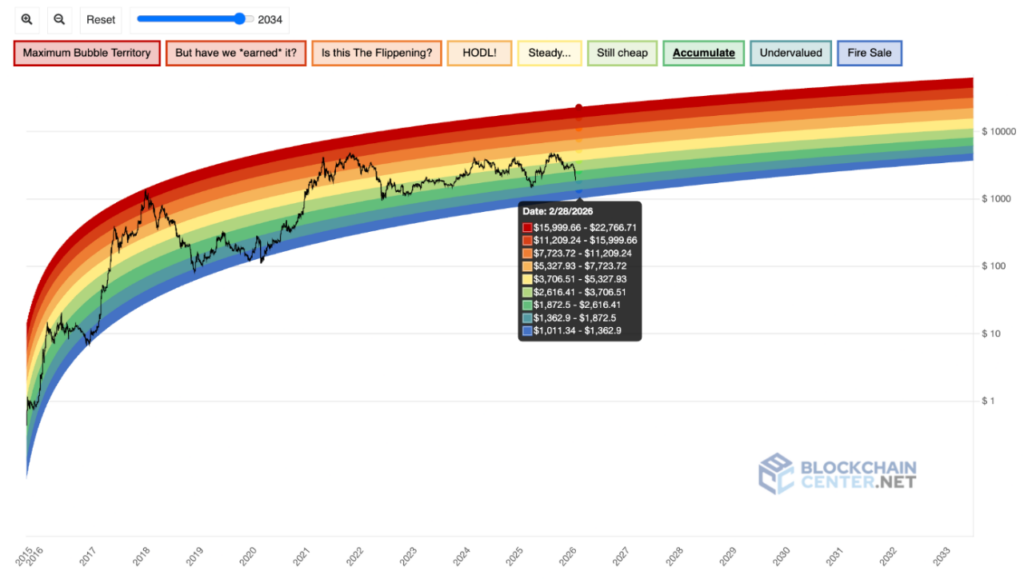 Ethereum Rainbow Chart. Source: Blockchain Center
Mid-range valuations fall into the ‘HODL!’ band at $5,327.93 to $7,723.72, a zone historically linked to sustained uptrends where long-term holders tend to remain confident. Below that, the ‘Steady…’ band covers $3,706.51 to $5,327.93, suggesting stable growth in line with long-term adoption trends.
The ‘Still cheap’ band, between $2,616.41 and $3,706.51, implies Ethereum remains undervalued relative to its historical growth curve. Deeper value territory appears in the ‘Accumulate’ band at $1,872.50 to $2,616.41, typically viewed as an attractive long-term entry zone.
Further down, the ‘Undervalued’ band ranges from $1,362.90 to $1,872.50, while the lowest zone, ‘Fire Sale’, spans $1,011.34 to $1,362.90, historically associated with capitulation phases.
Ethereum’s possible price range
With Ethereum trading around $2,000 on February 8, the token currently sits within the ‘Accumulate’ band.
If ETH continues to track the Rainbow Chart’s median historical trajectory into late February 2026, a move into the ‘Steady…’ or ‘HODL!’ zones would be plausible, implying a potential price range of roughly $4,000 to $6,000.
However, stronger-than-expected adoption, increased network usage, or a renewed crypto bull cycle could push Ether into higher bands, while broader market weakness could keep prices closer to the lower valuation ranges outlined by the model.
Featured image via Shutterstock
The post Ethereum Rainbow Chart predicts ETH price for February 28, 2026 appeared first on Finbold.


 English (US)