
 2 months ago
10054
2 months ago
10054

Ethereum is trading in a narrow range, but derivatives positioning suggests the market is far from calm underneath. CoinGlass data shows roughly $874 million in long positions face liquidation below $2,206, while $403 million in shorts face liquidation above $2,412.
The 24-hour realized liquidation picture skews bullish. Total forced closures reached approximately $33 million, with shorts accounting for $25.93 million and longs only $7 million, per CoinGlass.
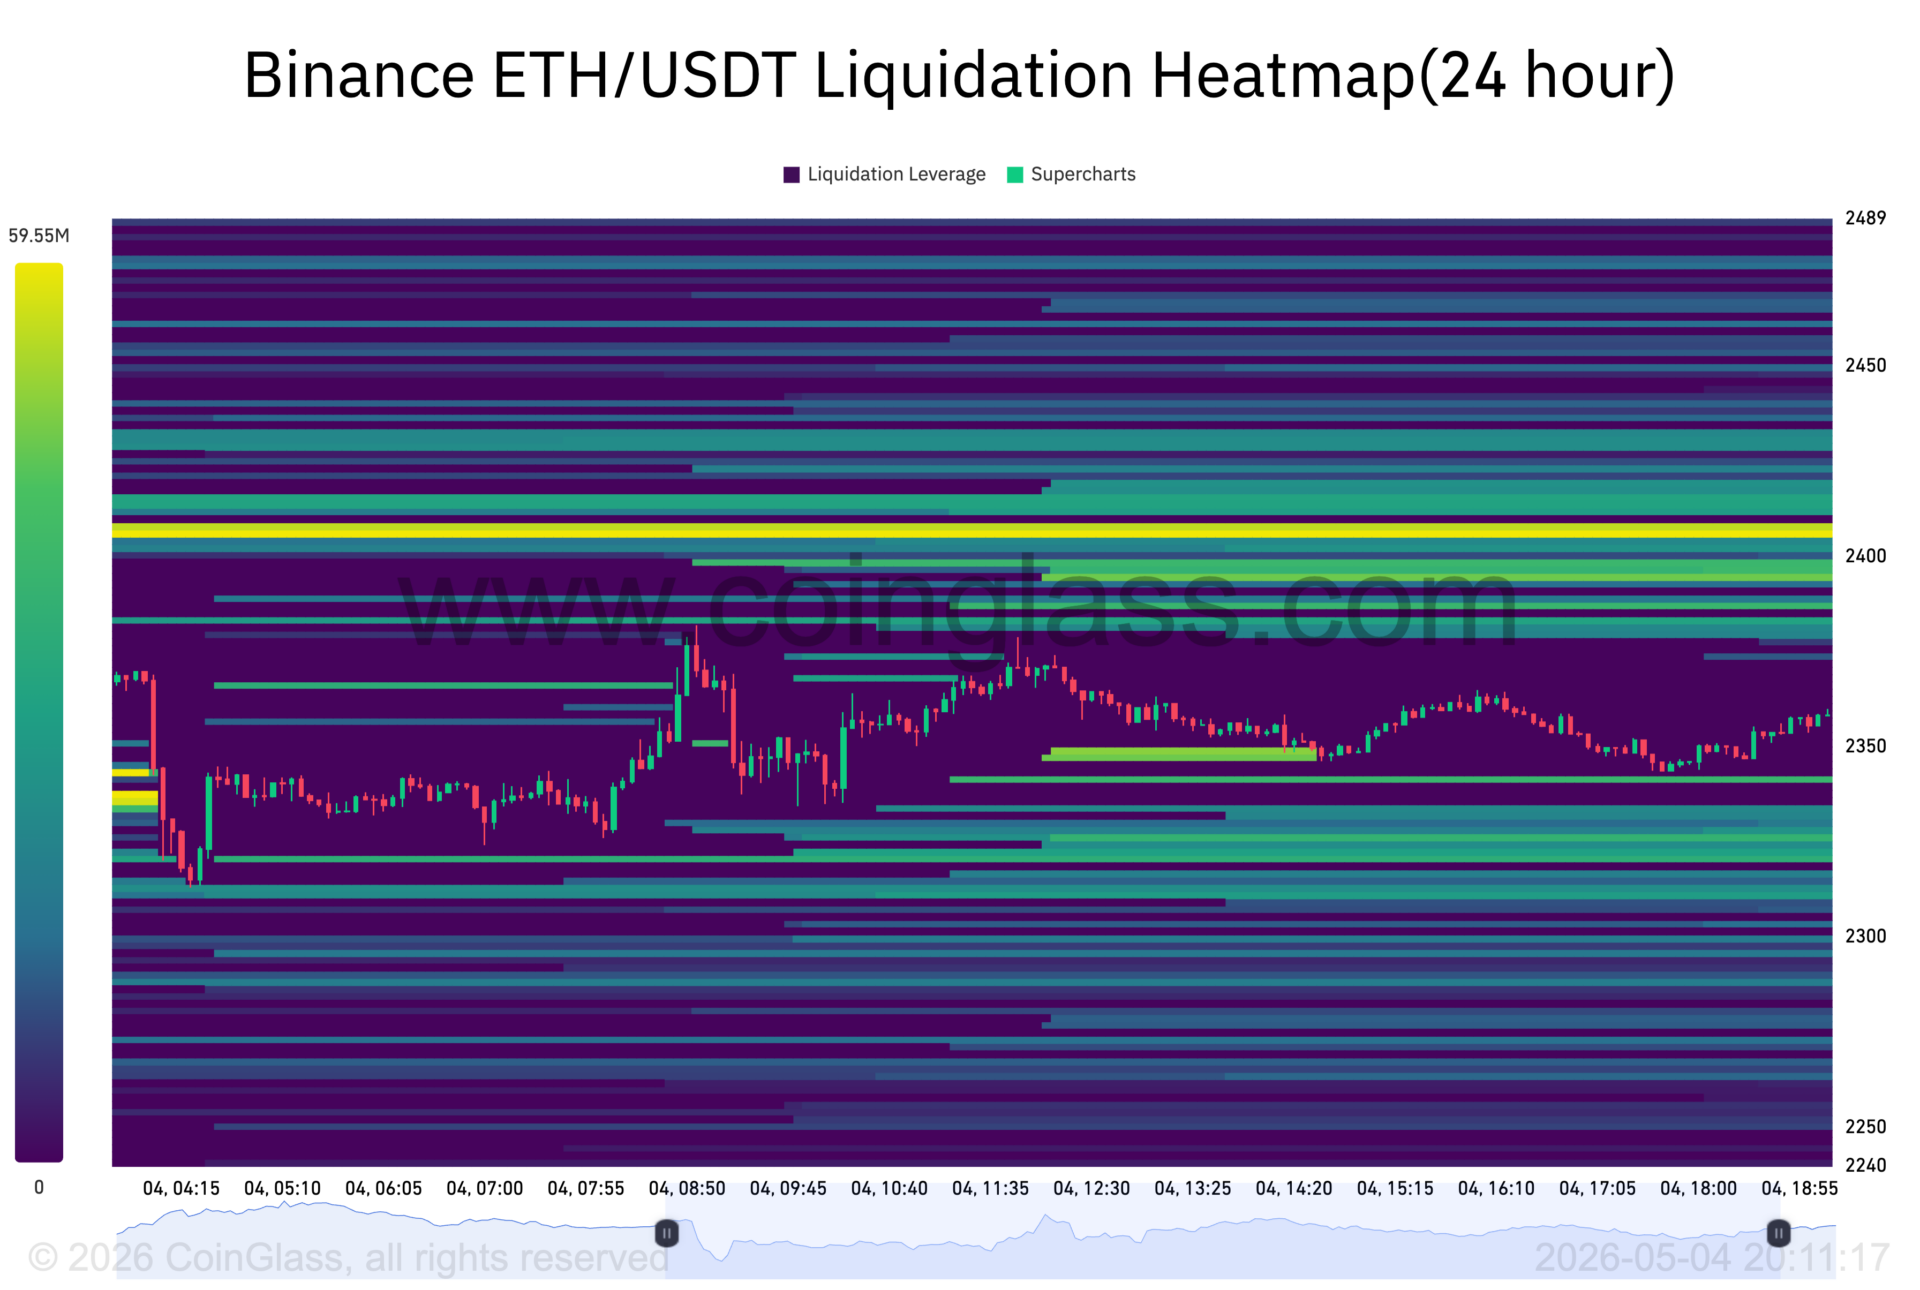 Ethereum liquidation heatmap showing concentrated leverage clusters around current price | Source: Coinglass
Whales bought 140,000 ETH while price held
Santiment data shows large holders accumulated more than 140,000 ETH between May 1 and May 3, worth roughly $322 million, shared by Ali Martinez. Whale balances moved from 13.83 million ETH to 13.98 million ETH over the window.
Whales have gone on a buying spree, accumulating over 140,000 Ethereum $ETH in the last 96 hours, worth around $322 million. pic.twitter.com/uHZqV3B0W9
— Ali Charts (@alicharts) May 3, 2026
CryptoQuant order-size data adds texture worth paying attention to. Whale buys clustered at $2,005 to $2,100 in early April, then migrated to $2,250 to $2,300 by late April.
On May 2, the largest single spot buy was 556 ETH at $2,316. Whales accumulated on the way up, not on weakness, which is the kind of detail that changes how you read the bid.
ETF flows turned positive after a rough week
Institutional flows turned positive again on May 1 after four straight days of outflows. Spot Ethereum ETFs recorded net inflows of $101.2 million per Farside Investors, with the bulk concentrated in two funds.
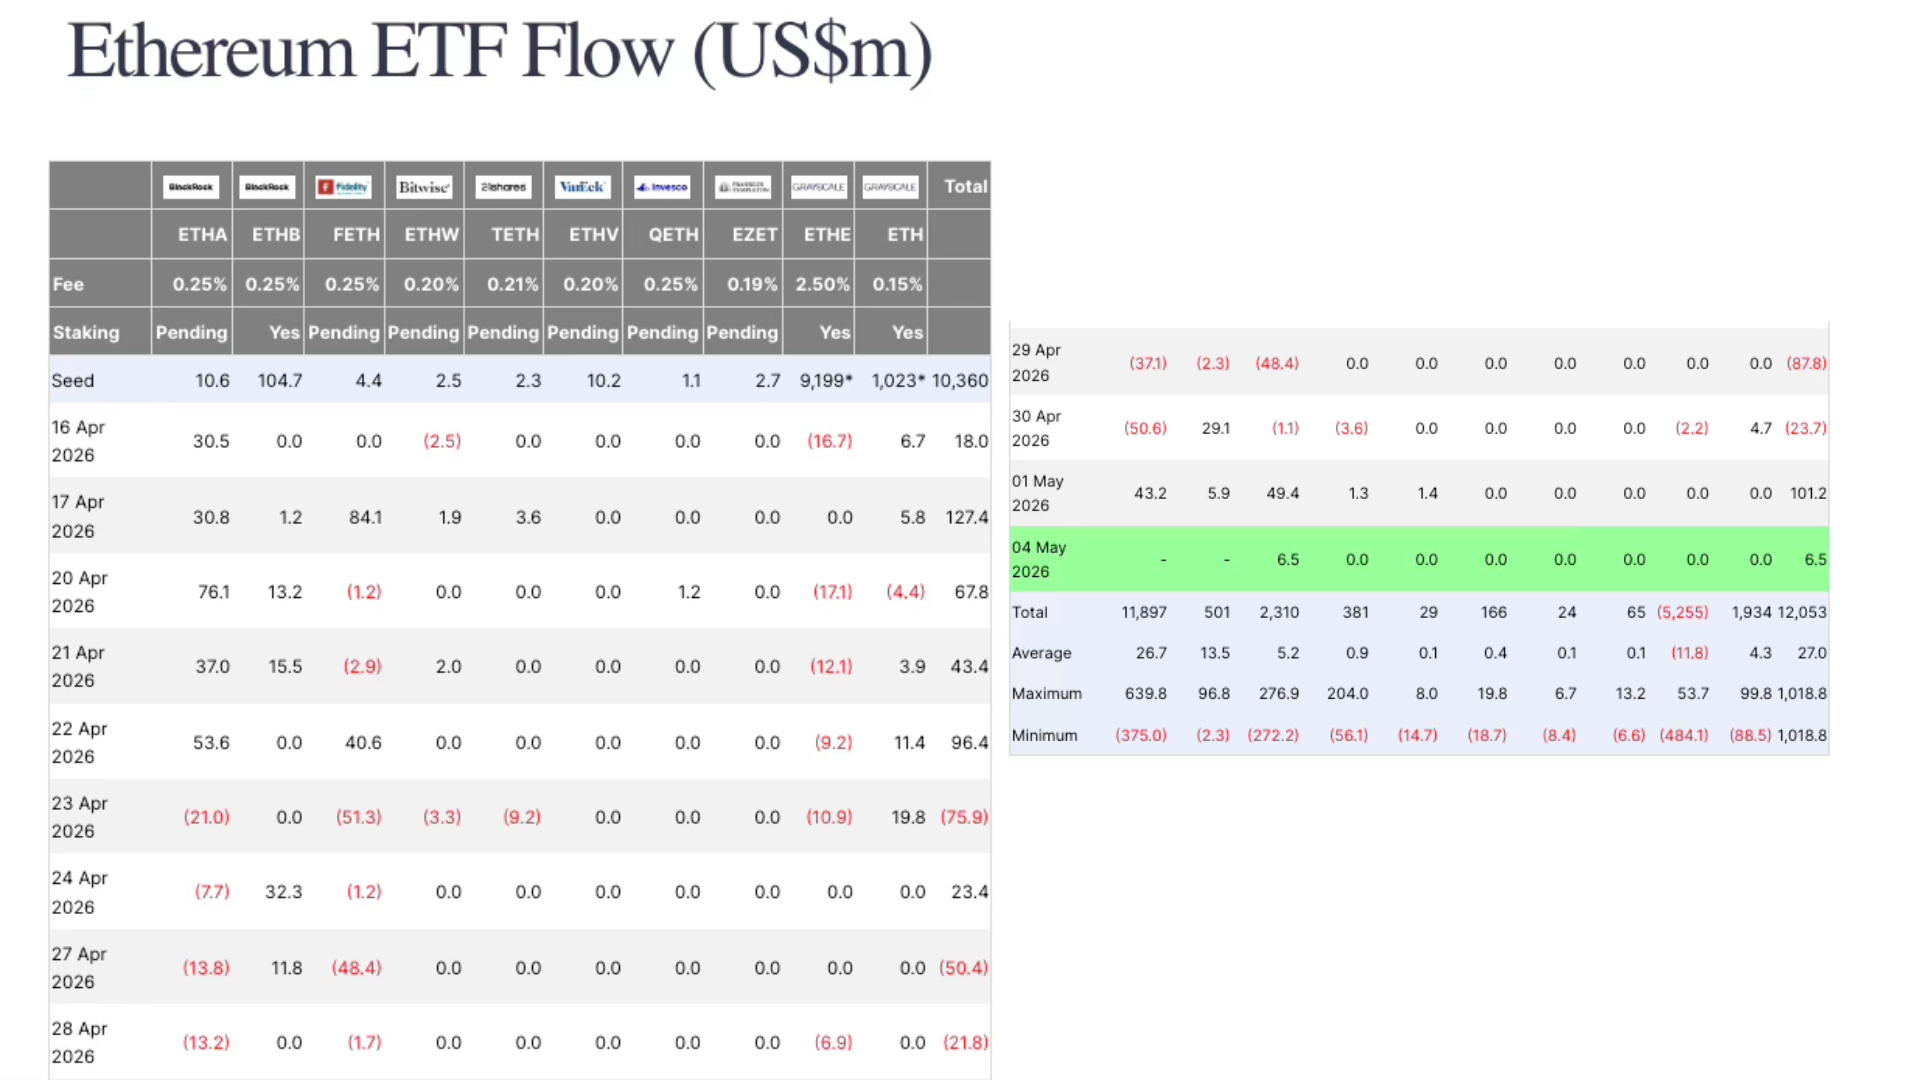 Ethereum ETF net flows show a May 1 reversal to $101.2M in inflows. | Source: Farside Investors
BlackRock’s ETHA pulled in $43.2 million. Fidelity’s FETH added $49.4 million. Other issuers had smaller, mixed flows.
$2,400 is the ceiling, but ETH/BTC is the bigger tell
Order book data shows dense sell-side liquidity between $2,350 and $2,500, which is why $2,400 has functioned as resistance. Analyst Ted Pillows put it bluntly: “ETH is still going sideways” until $2,400 is reclaimed.
The contrarian signal worth watching is the ETH/BTC ratio, currently around 0.0294. Michaël van de Poppe identified 0.032 as the breakout threshold. “If it clearly breaks 0.032 BTC, that’s where the party starts,” he wrote on X.
The ratio matters because whale accumulation in dollar terms can coexist with ETH continuing to underperform Bitcoin if cycle dominance hasn’t shifted yet.
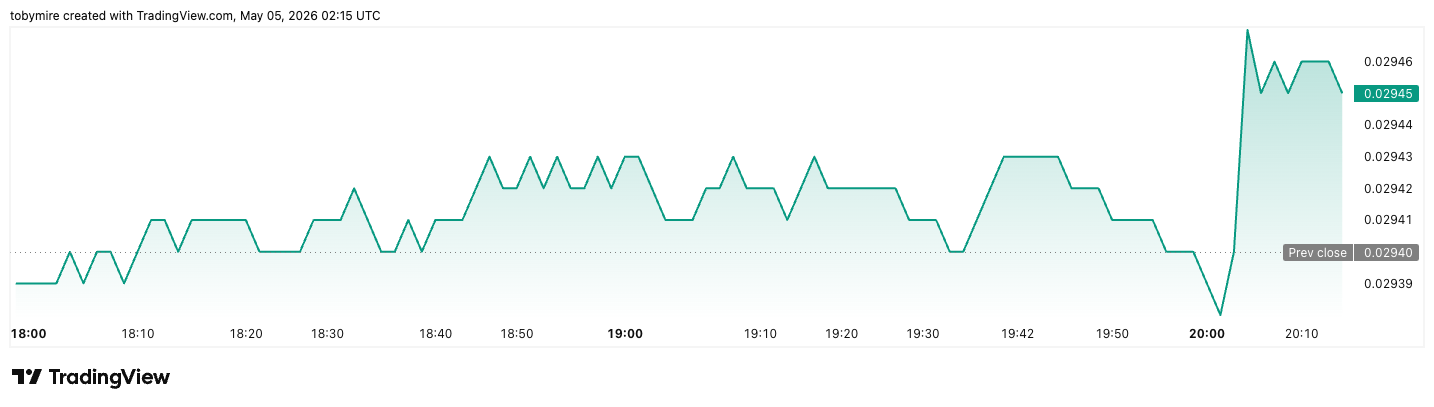 ETH/BTC ratio at 0.0294 with 0.032 as the breakout threshold. | Source: TradingView
The ratio matters because whale accumulation in dollar terms can coexist with ETH continuing to underperform Bitcoin if cycle dominance hasn’t shifted yet.
Cryptopolitan reported earlier that ETH built higher lows from $1,840 to $2,450 through March and April before pulling back, with the technical structure described as recovering but fragile.
Why the compression matters
Open interest sits around $30 billion, with ETH-specific 24-hour futures volume near $18 billion, while spot volume is under $1 billion. That ratio is what makes the setup unstable. Leverage is building faster than spot demand can resolve direction.
A clean break above $2,412 or below $2,206 would force liquidations that could amplify the move in whichever direction breaks first.
Until one of those levels gives, positioning rather than spot demand is what’s setting price.
Don’t just read crypto news. Understand it. Subscribe to our newsletter. It's free.


 English (US)