

Ethereum’s price has stabilized recently, settling into a narrow trading range near $2,342 in the four-hour chart analysis. With the current movement suggesting a consolidation phase, seasoned market watchers believe a consistent close over $2,375 could propel Ethereum towards key price targets between $2,800 and $3,161. These targets are under keen surveillance by market participants focusing on both short and long-term strategies.
How are key support zones affecting Ethereum’s movement?
Technical insights from analyst Na₿er highlight how Ethereum reclaimed a critical support range, marked between $2,130 and $2,180, post a recent rally. This support area is illustrated on charts as a green box indicating the consolidation phase. Despite multiple attempts to break higher, seller resistance has kept prices capped, emphasized by red “X” markers signaling potential jeopardy for traders holding short positions.
Na₿er suggests that the four-hour consolidation often preludes sharp price actions. He alerts traders to watch for volumes in green bars as they could indicate proactive position-building by market participants during this tight trading span.
“The $2,375 mark is pivotal. Once breached, we could witness a swift price ascension as short positions unwind and new purchases trigger upward momentum,” Na₿er noted.
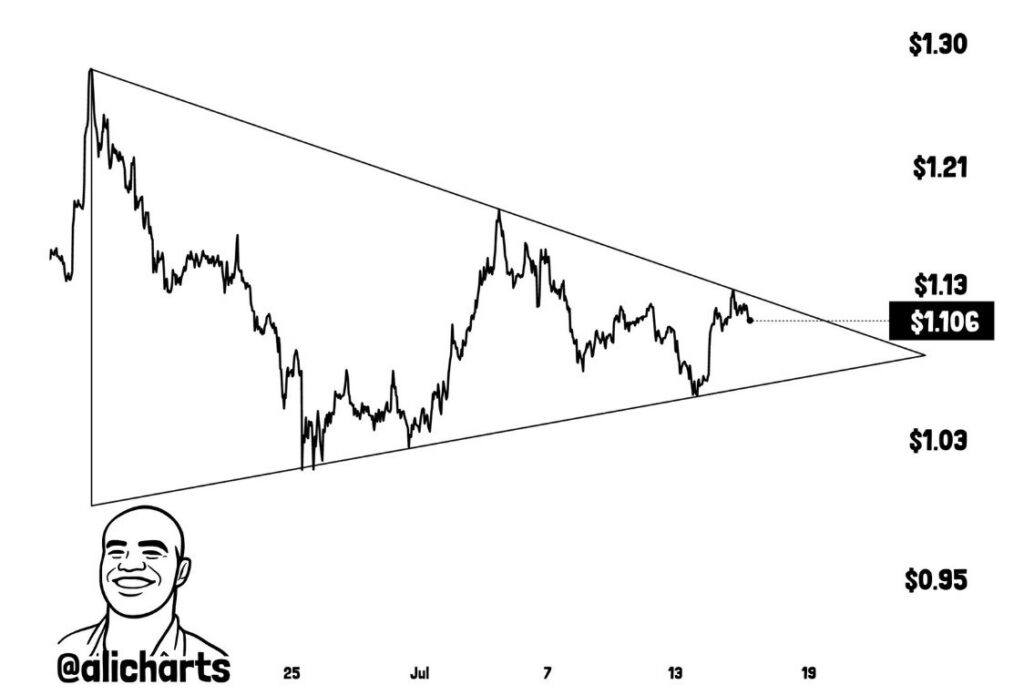
Is Ethereum ready for its next surge?
Analyst Sky’s research indicates Ethereum trades within a compact triangular pattern, hinting at probable breakout conditions while clinging to essential moving averages. This tight pattern, often culminating in notable movements, aligns with predictions for an upward breach with targets in the $2,961 to $3,161 corridor, aligning with the upper triangle boundary.
Ethereum’s earlier rebound phases in February and March have created a sideways price trajectory, continually testing the uptrend line. Historical triangle formations, like the one seen here, are precursors to increased market activity and potential volatility.

Sky projects an imminent “attack” on the $3,000 range. “With the neckline breached, supported by current volume metrics, a swift price elevation is plausible,” stated Sky.
For the bullish temperature to rise, Ethereum must cement daily positions over $2,460, as it aligns with Fibonacci levels, strengthening positive market forecasts. Contrastingly, dropping below key moving averages between $2,320 and $2,244 could negate the bullish sentiment.
Concrete insights from the data reveal crucial aspects:
- Consistent closing above $2,375 could accelerate a bullish breakout.
- Critical supports at $2,130 and potential resistance at $3,161 are essential in the current landscape.
- Volume and Fibonacci levels provide valuable predictors for future movements.
If Ethereum fails to hold recent support levels, downward revisions as low as $2,070 might materialize, potentially altering current optimistic narratives. The coming days will be pivotal in determining Ethereum’s next significant move.
Disclaimer: The information contained in this article does not constitute investment advice. Investors should be aware that cryptocurrencies carry high volatility and therefore risk, and should conduct their own research.


 English (US)