
 2 months ago
9751
2 months ago
9751

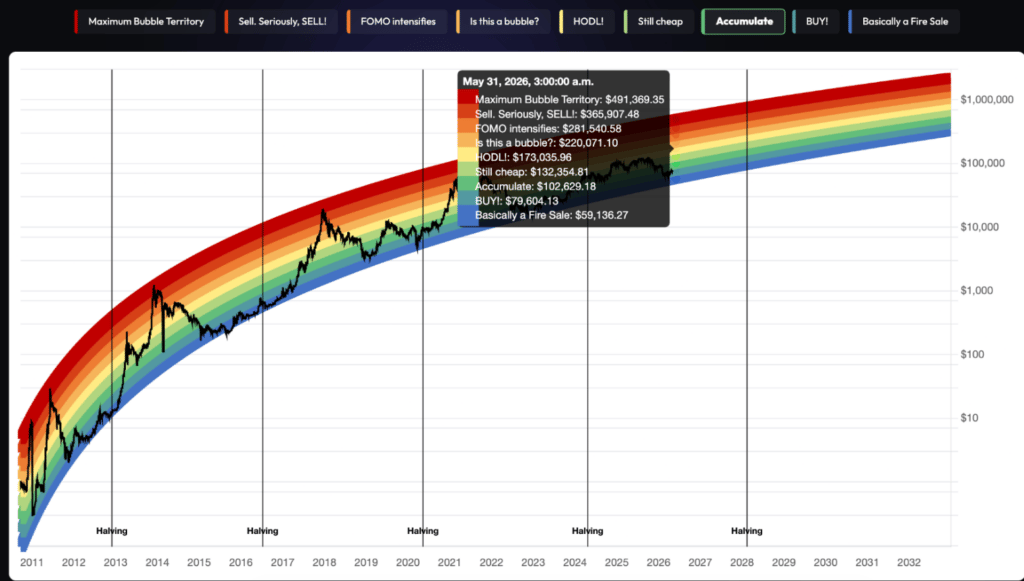
The Bitcoin (BTC) Rainbow Chart is suggesting that the cryptocurrency could trade between roughly $59,136 and $491,369 by May 31, 2026, depending on market sentiment and the strength of the cycle.
Notably, the chart is a logarithmic Bitcoin valuation model that uses colored bands to reflect market sentiment, from undervaluation to bubble territory, based on historical price cycles.
In this regard, data from the Rainbow Chart model places Bitcoin’s ‘Basically a Fire Sale’ band at $59,136.27 by May 31, representing the lower end of the valuation spectrum often associated with deep undervaluation and extreme market fear. The ‘BUY!’ zone is projected at $79,604.13, while the ‘Accumulate’ band stands at $102,629.18.
Higher on the scale, the ‘Still cheap’ range is estimated at $132,354.81, followed by the ‘HODL!’ level at $173,035.96. The chart’s midpoint speculative region, labeled ‘Is this a bubble?’, is projected at $220,071.10.
 Bitcoin Rainbow chart. Source: BlockhainCenter
In more aggressive bullish territory, the ‘FOMO intensifies’ band is forecast at $281,540.58, while the ‘Sell. Seriously, SELL!’ zone reaches $365,907.48. At the top of the spectrum, the ‘Maximum Bubble Territory’ level is projected at $491,369.35.
Bitcoin’s possible price target
As of May 2, Bitcoin was trading around $78,200, placing the asset near the lower-middle portion of the Rainbow Chart bands. Based on the May 31, 2026, projections, a move from the current price toward the ‘BUY!’ band at about $79,604 would imply relatively flat growth over the next year.
However, if Bitcoin advances into the ‘Accumulate’ or ‘Still cheap’ zones, the asset could trade between roughly $102,000 and $132,000 by that date.
Under a stronger bullish cycle, the model suggests Bitcoin may climb above $173,000 into the ‘HODL!’ region, while a highly speculative market phase could potentially push prices beyond $220,000 and toward the upper ‘FOMO intensifies’ or ‘Sell’ territories.
Bitcoin price analysis
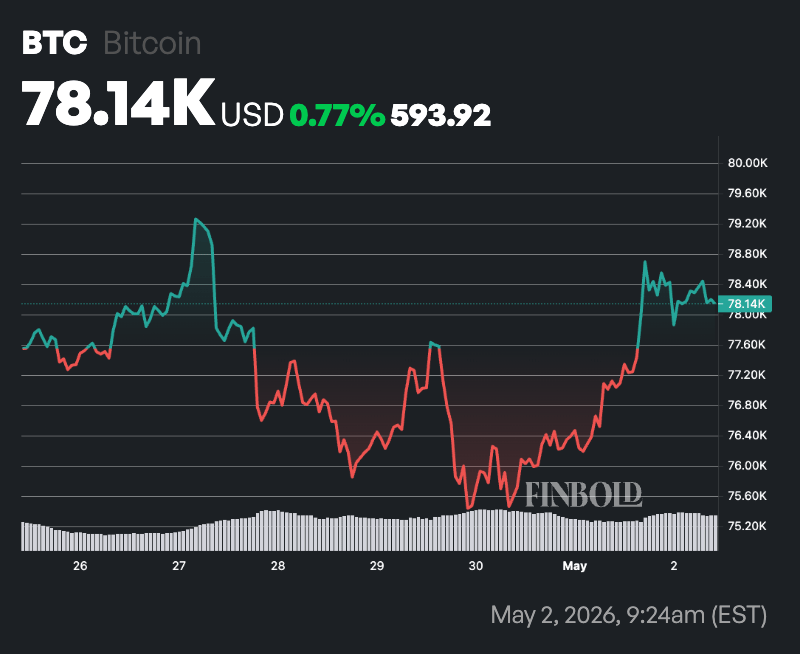
By press time, Bitcoin was trading at $78,140, up about 1.3% in the past 24 hours. On the weekly timeframe, BTC had gained roughly 0.77%.
 Bitcoin seven-day price chart. Source: Finbold
At the current price, Bitcoin remains above its 50-day simple moving average (SMA) of $72,359, a sign that short-term momentum continues to support the broader uptrend.
However, the asset is still trading below the 200-day SMA at $84,046, suggesting Bitcoin has yet to fully reclaim its longer-term bullish structure.
Meanwhile, the 14-day RSI stood at 60.88, indicating neutral-to-bullish momentum. The reading suggests buying pressure remains intact without Bitcoin entering overbought territory, leaving room for additional upside if momentum strengthens.
The post Bitcoin Rainbow Chart predicts BTC price for May 31, 2026 appeared first on Finbold.


 English (US)