
 3 months ago
10920
3 months ago
10920

As Bitcoin (BTC) continues to trade below the $70,000 level, the Rainbow Chart suggests the asset could remain under pressure toward the end of March.
As of press time, the cryptocurrency was trading at $67,535, down about 0.3% over the past 24 hours, while on the weekly timeframe, the asset has gained roughly 1.5%.
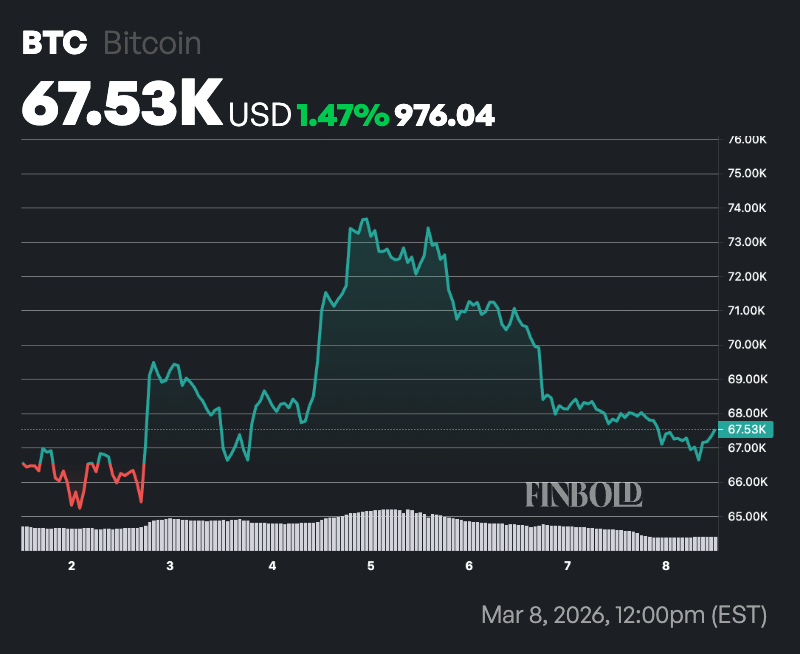 Bitcoin seven-day price chart. Source: Finbold
Notably, the Bitcoin Rainbow Chart uses logarithmic regression bands to illustrate historical price behavior across different market phases, ranging from deep undervaluation to speculative bubble territory.
Bitcoin price prediction
According to the latest projection for March 31, the lowest valuation band labeled “Basically a Fire Sale” places Bitcoin between $42,995.69 and $56,134.77. This zone historically represents periods when Bitcoin is considered heavily undervalued relative to its long-term trend.
 Bitcoin Rainbow chart. Source: BlockhainCenter
The next band, labeled “BUY!”, ranges from $56,134.77 to $75,631.88, indicating an attractive accumulation zone where long-term investors typically view Bitcoin as fundamentally cheap.
Above that is the “Accumulate” band, which spans $75,631.88 to $97,594.05. This region still suggests undervaluation but signals the market beginning to recover toward its long-term trajectory.
Moving higher, the “Still Cheap” band projects prices between $97,594.05 and $125,972.37, while the mid-cycle “HODL!” zone ranges from $125,972.37 to $164,842.17. Historically, these levels represent periods when Bitcoin trades near its long-term fair value, and investors are encouraged to hold rather than aggressively buy or sell.
Beyond this midpoint, the chart enters increasingly overheated territory. The band labeled “Is this a bubble?” places Bitcoin between $164,842.17 and $209,828.69, signaling growing speculative activity.
The next zone, “FOMO intensifies,” ranges from $209,828.69 to $268,676.59, reflecting a phase where fear of missing out drives strong retail demand.
Near the top of the spectrum, the “Sell. Seriously, SELL!” band spans $268,676.50 to $349,493.74, indicating historically stretched valuations where profit-taking becomes common. The highest band, “Maximum Bubble Territory,” projects extreme market exuberance with prices between $349,493.74 and $469,687.80.
Bitcoin ideal price level for March 31
With Bitcoin trading around $67,500, the cryptocurrency currently sits within the “BUY!” zone, which ranges from $56,134.77 to $75,631.88 in the March 31 projection.
Within the Rainbow Chart framework, this range suggests Bitcoin is still trading below its long-term trend value and remains relatively inexpensive compared with historical cycle peaks.
Based on this model, the ideal or fair-value region for Bitcoin by March 31 would be closer to the middle bands of the chart, particularly the “Still Cheap” to “HODL!” zones, which correspond to roughly $97,594 to $164,842.
Prices in this range would place Bitcoin nearer its long-term growth trajectory rather than the discounted levels currently implied by the lower bands.
Although not intended for precise short-term predictions, the Rainbow Chart serves as a visual framework for assessing Bitcoin’s position within its broader market cycle.
Featured image via Shutterstock
The post Bitcoin Rainbow Chart predicts BTC price for March 31, 2026 appeared first on Finbold.


 English (US)