
 2 months ago
9214
2 months ago
9214

The latest projection from the Bitcoin (BTC) Rainbow Chart suggests the asset could trade in a wide range between $41,882 and $459,303 by March 1, 2026.
This outlook comes as Bitcoin continues to face key rejections amid a broader cryptocurrency market correction. At press time, the asset was trading at $68,508, down 2.5% in the past 24 hours and about 0.3% on the weekly timeframe.
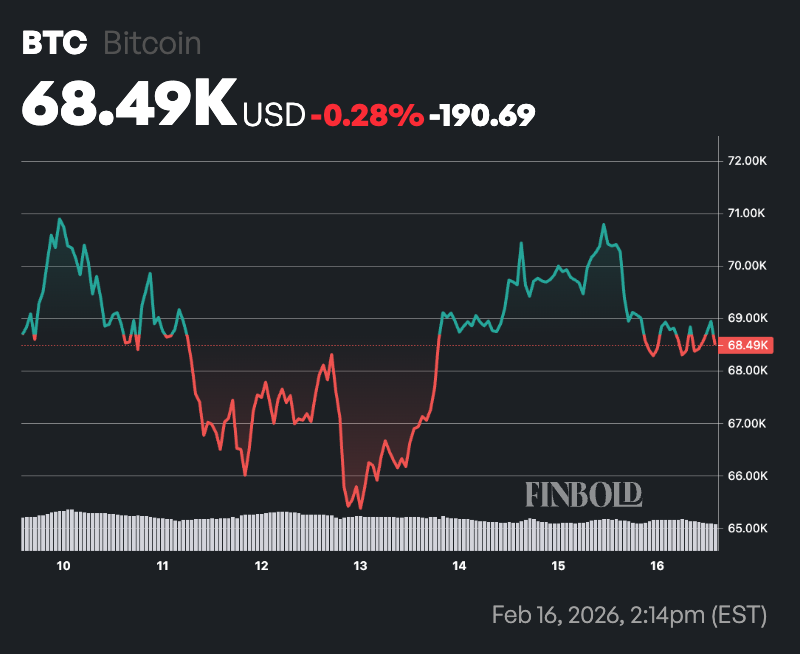 Bitcoin seven-day price chart. Source: Finbold
The Rainbow Chart is a long-term valuation framework rather than a short-term timing tool. Based on current prices and past cycle trends, it indicates notable upside potential over the next year, ranging from steady gains to a possible late-cycle surge depending on market momentum.
Bitcoin price prediction
For March 1, the lowest band, ‘Basically a Fire Sale,’ ranges from $41,882 to $54,704 and signals extreme undervaluation where long-term investors have historically stepped in aggressively.
Above that, the ‘BUY’ zone spans $54,704 to $73,737, indicating strong value territory with favorable risk-reward conditions. The ‘Accumulate’ band, between $73,737 and $95,191, reflects relatively cheap pricing within the broader cycle, often associated with steady long-term positioning.
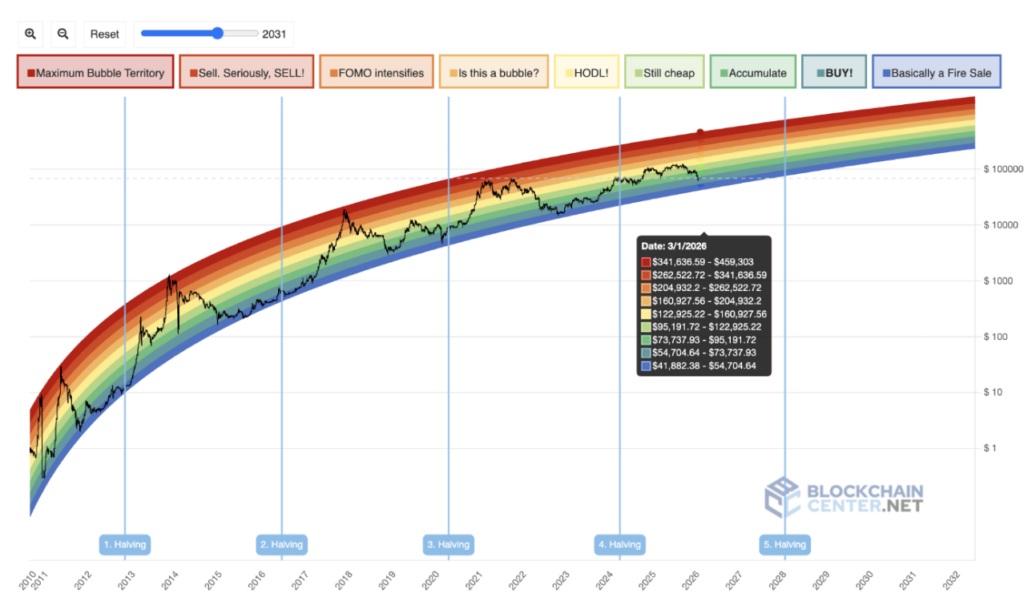 Bitcoin Rainbow chart. Source: BlockhainCenter
At the same time, the ‘Still Cheap’ range extends from $95,191 to $122,925, suggesting Bitcoin remains undervalued but no longer deeply discounted.
The ‘HODL’ zone, from $122,925 to $160,927, represents fair value within a bullish cycle where holding, rather than aggressive buying, has historically been favored.
The ‘Is This a Bubble?’ band runs from $160,927 to $204,932, indicating rising speculative enthusiasm and elevated valuations. Meanwhile, the ‘FOMO Intensifies’ range, between $204,932 and $262,522, signals accelerating investor excitement and momentum-driven buying.
The ‘Sell. Seriously, SELL!’ zone spans $262,522 to $341,636 and has historically been associated with late-cycle euphoria and heightened correction risk.
At the top, ‘Maximum Bubble Territory’ ranges from $341,636 to $459,303, reflecting extreme overvaluation conditions that have previously preceded major reversals.
Bitcoin’s possible price for March 1
With Bitcoin trading at $68,508 on February 16, it currently sits within the ‘BUY’ region based on the March 2026 forward curve, slightly above the lower accumulation threshold.
If Bitcoin follows the model’s mid-range trajectory, a move toward the ‘HODL’ or ‘Is This a Bubble?’ zones would imply a price between roughly $122,000 and $200,000 by March 1, 2026.
A full speculative cycle similar to prior halving-driven rallies could push prices into the $260,000 to $340,000 range, while an extreme euphoric phase would require a surge toward or above $400,000.
Conversely, if macroeconomic pressure or weakened demand slows the cycle, Bitcoin could remain below $95,000 in early 2026, keeping it within the accumulation bands rather than entering overheated territory.
Featured image via Shutterstock
The post Bitcoin Rainbow Chart predicts BTC for March 1, 2026 appeared first on Finbold.


 English (US)