
 2 months ago
7327
2 months ago
7327

The post Bitcoin Price Prediction 2026: The Breakout Condition You Need to Know appeared first on Coinpedia Fintech News
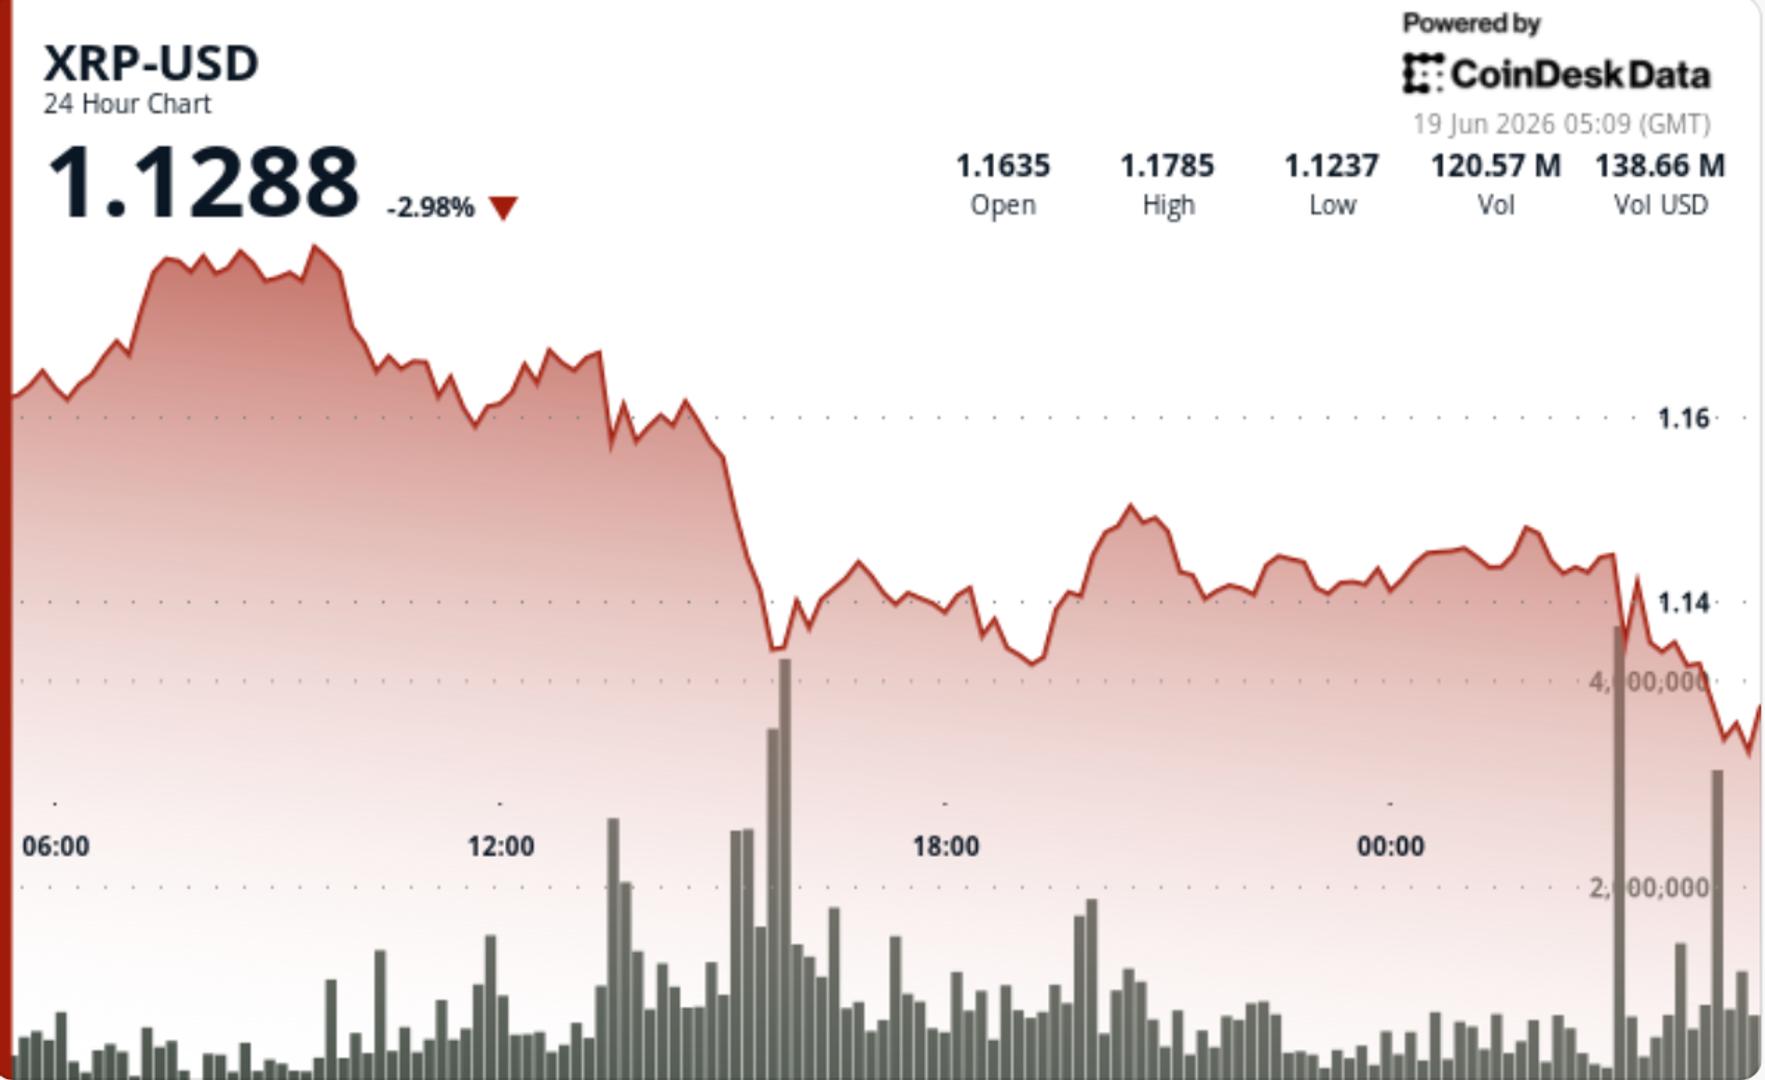
Bitcoin (BTC) has recently breached the key psychological support level of $70,000, trading at $68,739.30 (-3.49% in 24h) at press time.
This happened after the Pentagon reported plans to execute a “final blow” on Iran, in addition to the upcoming expiration of $16.4 billion in Bitcoin and Ethereum options on Friday.
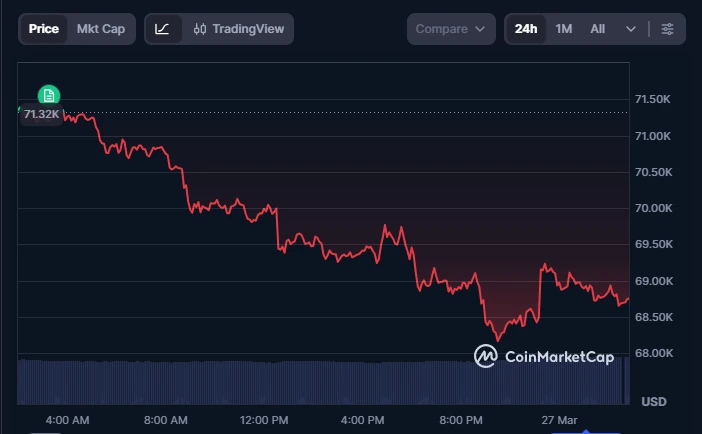
Source: CoinMarketCap
Bitcoin breakout signal
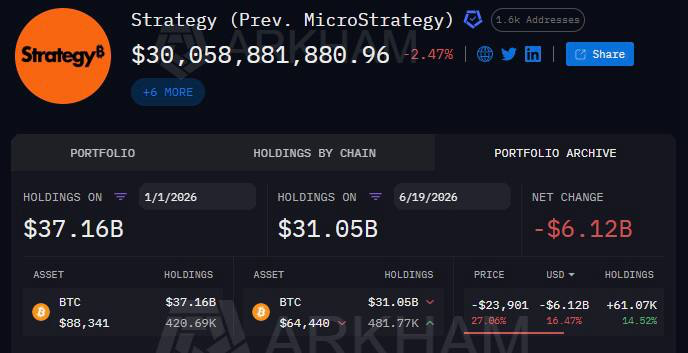
Nonetheless, on-chain data show persistence in whale accumulation, with wallets holding between 10 and 10,000 BTC increasing their positions by 0.45% (61,568 BTC) over the past month.
Consistent accumulation is generally a sign that the market is ripe for bullish momentum.
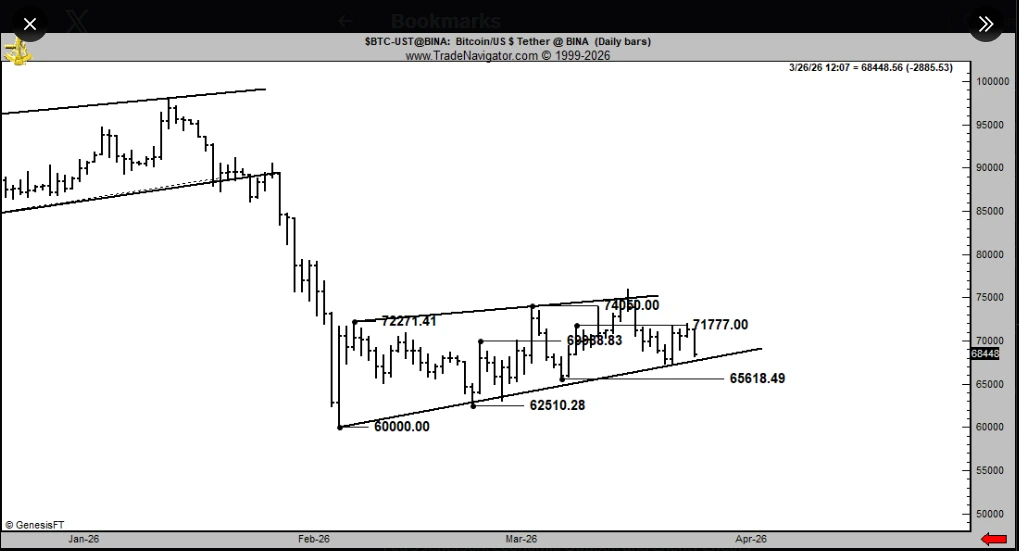
Still, the digital asset’s price has continued to drift, failing to break above $75,000 over the past month.
Beyond macroeconomic and geopolitically driven uncertainty, retail fear of missing out (FOMO) is contributing to the price pullback.
According to market intelligence platform Santiment, retailers’ accumulation of Bitcoin is moving in tandem with that of sharks and whales. In the past month, wallets with under 0.01 BTC have added onto their stash by 0.42%.
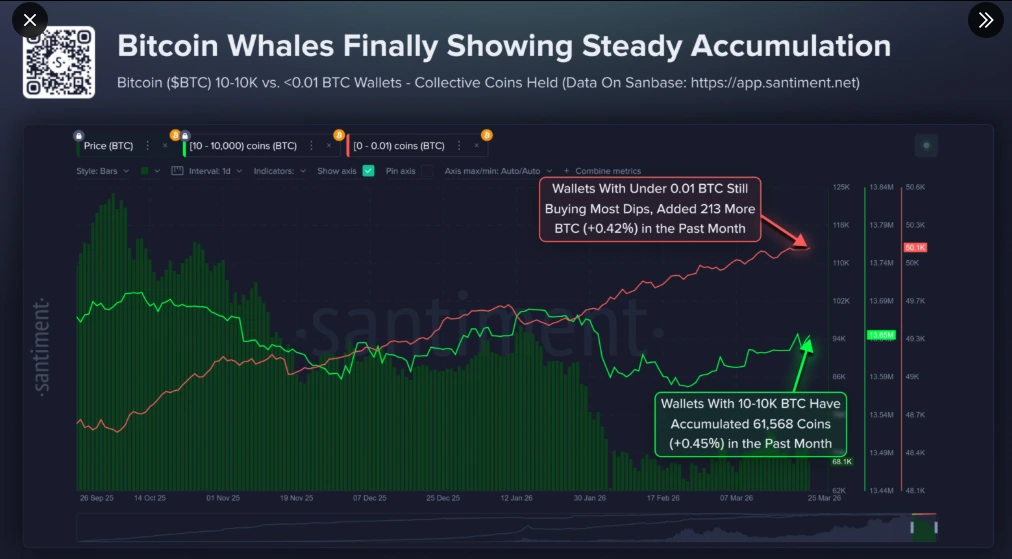
Source: Santiment
Bitcoin has historically shifted from bearish to bullish momentum when the actions of these two investors diverged – long-term holders expressed immense buying pressure as short-term holders exited the market.
Until we attain such a trend, the digital asset is likely to experience prolonged sideways movement. Fed actions, inflation reports, and developments in the ongoing US-Iran conflict will continue to drive price volatility.
Near-term BTC movement
In the near term, analysts point to an impending capitulation, driven by historical trends and economic pressures.
Source: X
Another analyst points out that a dip below $48,387 (the long-term holder realized price) and the -0.2 standard deviation band ($36,657) have historically sparked bull runs. And each time the gains exceeded 300% within 18 months.
The gold-Bitcoin narrative supports this theory, in which Bitcoin experienced a V-shaped recovery following a surge and cool in gold prices.
Bleak forecasts hint at a possible recession due to unemployment, economic shifts, and the West-Middle East friction.


 English (US)