
 2 months ago
11058
2 months ago
11058


The post Bitcoin Loses Crucial Support—Could This Mark the Longest Monthly Bearish Run for BTC Price? appeared first on Coinpedia Fintech News
The Bitcoin price experienced a significant drop in the past sessions, dropping close to $65,500. The drop is primarily driven by the largest single-day outflow from the U.S. spot Bitcoin ETFs in three weeks. It has slipped below a key short-term support, triggering fresh concerns over a deeper pullback. After repeated rejections near the $70K zone, the latest breakdown has weakened bullish momentum and shifted near-term sentiment toward caution.
With BTC now trading around $66K, the focus has turned to whether this move is a temporary correction—or the beginning of a broader downside phase heading into the monthly close.
Why Bitcoin Price Is Dropping Today
The latest pullback has raised the possibility of yet another bearish monthly close after marking five months in the red. The current decline is not driven by a single factor but rather a confluence of pressure points:
- Macro uncertainty: Rising geopolitical tensions and surging oil prices have triggered a global risk-off sentiment, pushing investors away from volatile assets like crypto
- Derivatives-led volatility: A large wave of liquidations has wiped out leveraged long positions, accelerating downside momentum
- Options expiry impact: Recent expiry events have increased short-term volatility, with price gravitating toward key liquidity zones
- Profit-taking: After multiple rallies, short-term holders appear to be booking gains near resistance
This combination has created a cascade effect, where selling pressure feeds further downside.
BTC Liquidation Heatmap Signals Volatility Ahead
The 12-hour liquidation heatmap highlights a liquidity-driven setup, where Bitcoin’s next move is likely to target leveraged positions rather than follow a clean trend. A major liquidity cluster sits between $67K and $69K, acting as a potential upside magnet. If BTC reclaims nearby resistance, a short-term move toward this zone could trigger liquidations and fuel volatility.
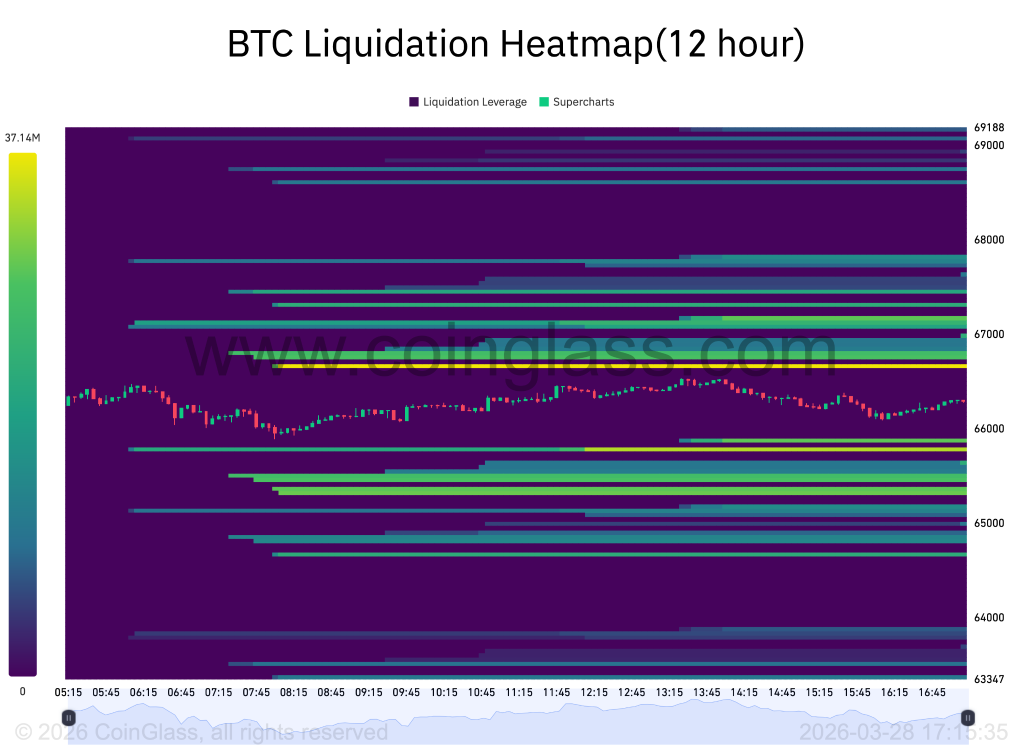
On the downside, strong liquidity is concentrated around $64K–$65K, making it a key target if current support levels fail. This creates a liquidity sandwich structure, with price caught between two high-liquidity zones. Notably, liquidity near the current $66K range is relatively thin, suggesting the market may avoid consolidation and instead move sharply toward either side.
Bitcoin Price Analysis: Can BTC Defend $65,000?
The 4-hour chart of Bitcoin (BTC/USDT) shows a clear shift in short-term market structure, with the price breaking below a crucial ascending trendline and slipping under key moving averages. This breakdown signals weakening bullish momentum and rising downside risk. Bitcoin had been trading within an ascending trend, supported by a rising trendline, since late February. However, the recent sharp drop has decisively broken this support, indicating that buyers have lost control in the short term.
Such breakdowns often act as early signals of a trend reversal or deeper correction, especially when accompanied by increased selling pressure.
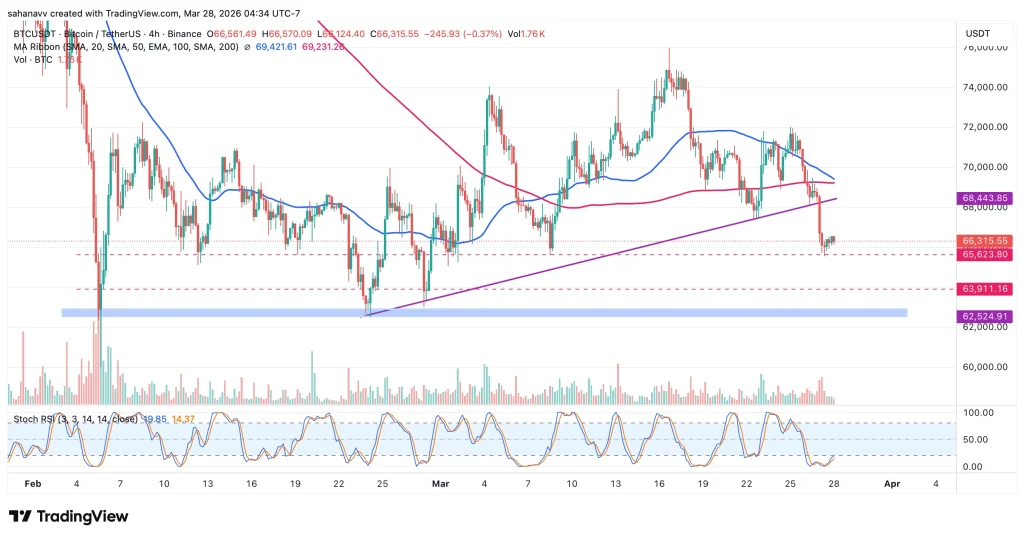
The price is now trading below the 50-day and 200-day moving averages, positioned around the $68.4K–$69.2K range. This zone has flipped into a strong resistance area, limiting upside attempts. As long as BTC remains below this range, the market is likely to stay under bearish pressure in the near term.
Bitcoin is currently hovering near immediate support around $65.6K. A breakdown below this level could accelerate the decline toward $63.9K, which is a strong horizontal support and $62.5K, which is the major demand zone and high-confluence support. These levels are critical for maintaining the broader structure. Losing them may open the door for a deeper correction phase.
The Stochastic RSI is currently near oversold levels, suggesting that a short-term relief bounce is possible. However, this does not confirm a trend reversal and may simply result in a temporary pullback toward resistance.
Conclusion — Will Bitcoin Close the Month Bearish?
Bitcoin price is approaching a critical monthly close, with price action currently favoring the bears after losing key support and trendline structure. As long as BTC trades below the $68.4K–$69.2K resistance zone, the market remains vulnerable to further downside. A sustained breakdown below $65.6K could accelerate the decline toward the $63.9K–$62.5K demand zone, increasing the likelihood of a bearish monthly close.
A strong reclaim of $68.4K–$69.2K could invalidate the breakdown and push Bitcoin back toward the $70K level. Or a Continued rejection below resistance may drive BTC toward $63.9K or even $62.5K, which is more likely.


 English (US)