
 4 weeks ago
5949
4 weeks ago
5949

Key takeaways:
- Our ARB predictions anticipate a high of $0.31 in 2026.
- In 2028, the range is expected to be between $0.61 and $0.74, with an average price of $0.63.
- In 2030, it will range between $1.24 and $1.52, with an average price of $1.28.
Layer 2s have generated considerable buzz for their efficiency. Arbitrum network is in the top 5 pack, with a total value locked (TVL) of $1.60 billion. Arbitrum is an Optimistic Rollup solution that shifts network operations away from the Ethereum mainnet while maintaining Ethereum-level security.
Is Arbitrum a good investment? Will it go up? Where will it be in 5 years? Let’s answer these questions and more in our Arbitrum price prediction.
Overview
| Cryptocurrency | Arbitrum |
| Current Arbitrum price | ARB |
| Market cap | $467.62M |
| Trading volume | $32.48M |
| Circulating supply | $6.36B |
| All-time high | $2.40 on Jan 12, 2024 |
| All-time low | $0.07067 on Jun 26, 2026 |
| 24-hour high | $0.07564 |
| 24-hour low | $0.07296 |
Arbitrum price prediction: Technical analysis
| Metric | Value |
| Volatility (30-day variation) | 9.94% |
| 50-day SMA | $0.09864 |
| 200-day SMA | $0.1288 |
| Sentiment | Bearish |
| Green days | 11/30 (37%) |
| Fear and Greed Index | 18 (Extreme Fear) |
Arbitrum price analysis
On June 28, Arbitrum’s price fell 1.78% over 24 hours and 29.99% over the last 30 days. The drop reflected recent ARB price action, accompanied by waning trading volume (-24.47%). Shifts in capital allocation and global regulatory changes can also move ARB independently of network milestones.
ARB 1-day chart analysis
 ARBUSD chart byTradingView
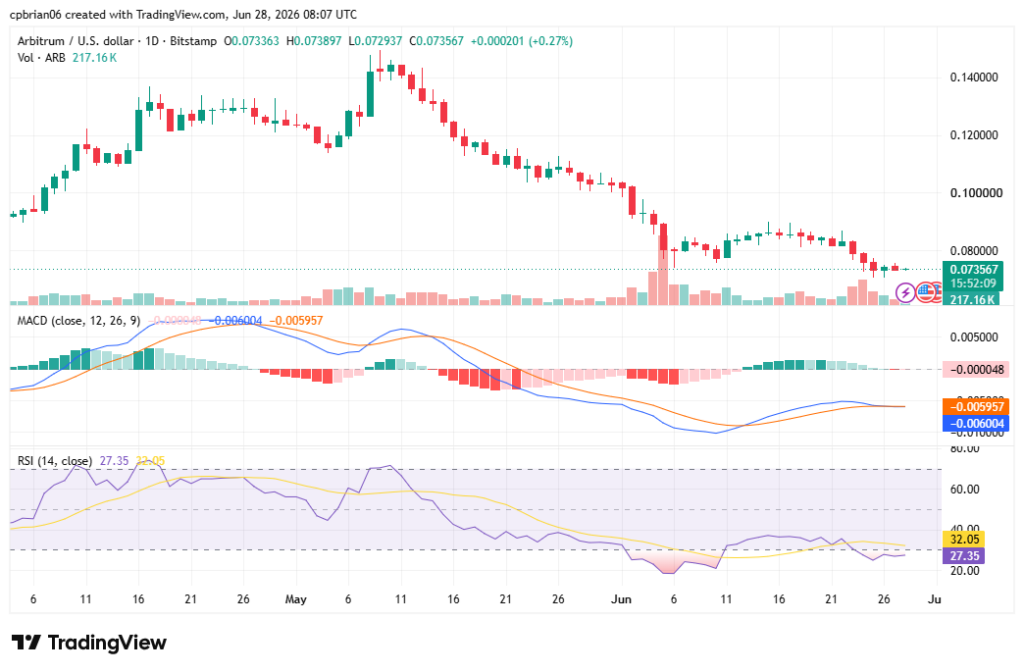
ARB has consistently traded lower, reflecting a short-term bearish trend. The drop tracked the broader altcoin rally, driven by capital rotation from the sector — reflected in a declining Altcoin Season Index. ARB now has support at $0.077.
Arbitrum price 4-hour chart price analysis
 ARBUSD chart by TradingView
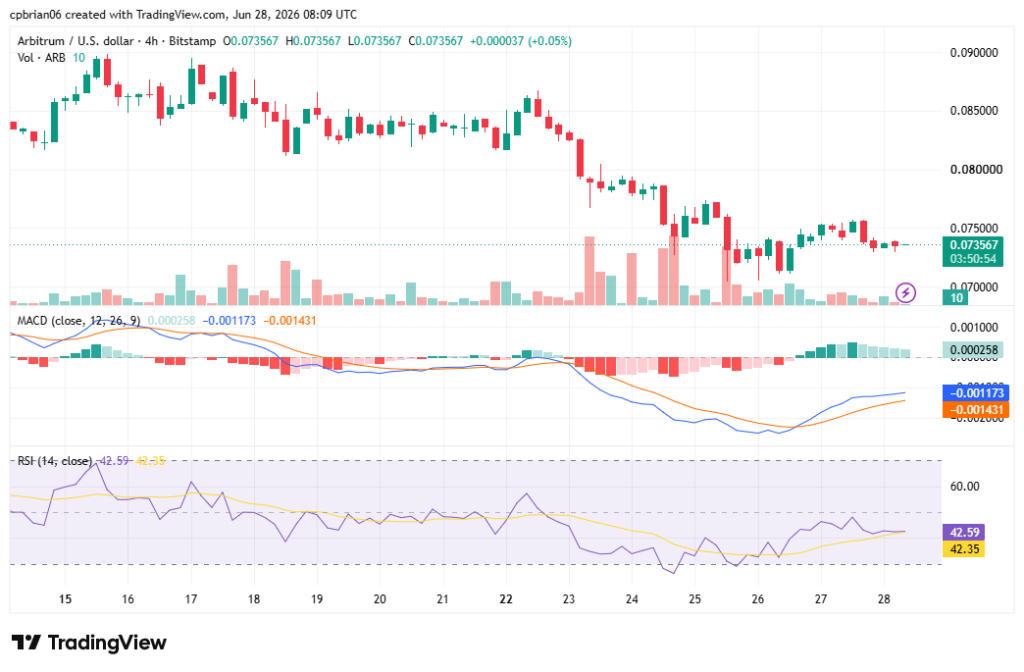
ARB registered a new all-time low (ATL) of $0.071 two days ago. The chart highlights ARB run following the drop. With its Relative Strength Index at 42.59, the chart suggests ARB is neutral. Nearby resistance at $0.078 levels could cap any rebound as long as bearish sentiment persists.
Arbitrum technical indicators: Levels and action
Daily simple moving average (SMA)
| Period | Value ($) | Action |
| SMA 3 | 0.07328 | SELL |
| SMA 5 | 0.07478 | SELL |
| SMA 10 | 0.07897 | SELL |
| SMA 21 | 0.08110 | SELL |
| SMA 50 | 0.09864 | SELL |
| SMA 100 | 0.1050 | SELL |
| SMA 200 | 0.1288 | SELL |
Daily exponential moving average (EMA)
| Period | Value ($) | Action |
| EMA 3 | 0.07387 | SELL |
| EMA 5 | 0.07514 | SELL |
| EMA 10 | 0.07777 | SELL |
| EMA 21 | 0.08244 | SELL |
| EMA 50 | 0.09316 | SELL |
| EMA 100 | 0.1068 | SELL |
| EMA 200 | 0.1461 | SELL |
What to expect from the ARB price analysis next?
Arbitrum is moving downwards on the shorter timeframes, with moving averages still leaning bearish. ARB could drop to support at $0.07 before the next leg up.
Why is Arbitrum down?
ARB’s price remains below major moving averages, confirming the bearish trend structure. The RSI14 at 27.35 is deeply oversold but not reversing, suggesting sustained selling pressure without significant buyer absorption. Volume fell, indicating the move lacks conviction but also shows no urgency to buy the dip.
Does Arbitrum have a future?
As a Layer-2 scaling solution for the Ethereum network, high adoption is crucial to Arbitrum’s long-term success and sustainability. Arbitrum’s performance in this regard is a positive sign for its future prospects despite price declines. As an L2 network, its growth also depends on Ethereum upgrades, rollup-focused development, and the broader ecosystem supporting the base layer. Rising active addresses, transaction volume, and dApp expansion can strengthen organic utility and support token value over time.
Recent news
A scheduled unlock of 1.68% of ARB’s circulating supply, valued at $7.76 million, is set for June 16. Such events often create anticipatory selling pressure as the market prices in the potential dilution from newly liquid tokens.
ARB price prediction June 2026
The Arbitrum price forecast for June ranges from $0.0750 to $0.1001. The average price for the month will be $0.0809.
| Month | Potential low ($) | Potential average ($) | Potential high ($) |
| June | 0.0750 | 0.0809 | 0.1001 |
Arbitrum price prediction 2026
For 2026, ARB’s price will range between $0.06 and $0.31. The average price for the period will be $0.21. Other market analysis projects 2026 between $0.08574 and $0.251, with an average of $0.1683.
| Year | Potential low ($) | Potential average ($) | Potential high ($) |
| 2026 | 0.0608 | 0.2122 | 0.3109 |
Arbitrum price prediction 2027-2032
| Year | Potential low ($) | Potential average ($) | Potential high ($) |
| 2027 | 0.4207 | 0.4364 | 0.5134 |
| 2028 | 0.6123 | 0.6341 | 0.7447 |
| 2029 | 0.8807 | 0.9124 | 1.06 |
| 2030 | 1.24 | 1.28 | 1.52 |
| 2031 | 1.73 | 1.78 | 2.10 |
| 2032 | 2.55 | 2.64 | 3.00 |
Arbitrum price prediction 2027
Arbitrum market price prediction climbs even higher into 2027. Some crypto analysts place 2027 in a wider comparative range of $0.157 to $0.446, with an average near $0.3015. According to the prediction, ARB’s price will range from $0.42 to $0.51, with an average of $0.44.
Arbitrum coin price prediction 2028
Our analysis indicates a further acceleration in ARB’s price. It will trade between $0.61 and $0.74 and an average price of $0.63.
Arbitrum price prediction 2029
According to the 2029 Arbitrum forecast, the price of ARB will range from $0.88 to $1.06, with an average of $0.91.
ARB price prediction 2030
The ARB price prediction for 2030 is $1.24-$1.52, with an average of $1.28. Broader 2030 projections place ARB between $2.46 and $5.78, with an average of $4.12. In a bullish scenario, some forecasts extend toward $12.00 depending on Layer-2 adoption, Ethereum scaling upgrades, TVL, crypto market sentiment, and network competition.
Arbitrum price prediction 2031
The Arbitrum price forecast for 2031 is a high of $2.10. It will reach a minimum price of $1.73 and an average price of $1.78.
Arbitrum ARB price prediction 2032
The year 2032 will also be bullish. Our analysis estimates a price range of $2.55 to $3.00, with an average price of $2.64.
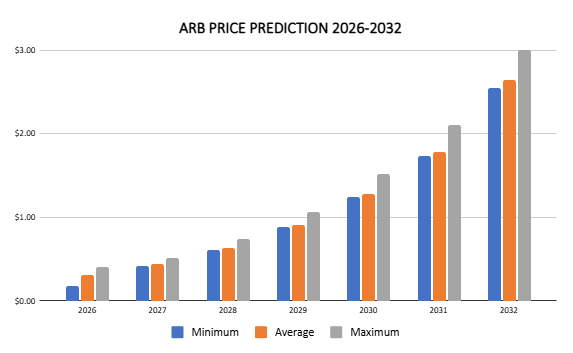 Arbitrum price prediction 2026-2032
ARB market price prediction: Analysts’ ARB price forecast
This table compares analyst market analysis on the price of Arbitrum across leading platforms.
| Platform | 2026 | 2027 | 2028 |
| Coincodex | $0.09635 | $0.2156 | $0.1447 |
| Gate.com | $0.1234 | $0.1517 | $0.1237 |
Cryptopolitan’s ARB price prediction
Our predictions indicate that ARB will reach a high of $0.31 in 2026. At its current price below $1, ARB would need a 1000% surge to reach $10, which would likely take several years even in favorable conditions. Since its launch, ARB has peaked at $2.40, so a $10 target at the current price level seems highly implausible. In 2028, the range is expected to be between $0.61 and $0.74, with an average of $0.63. In 2030, the range is likely to be between $1.24 and $1.52, with an average of $1.28. Do your own research and invest at your own risk.
Arbitrum historic price sentiment
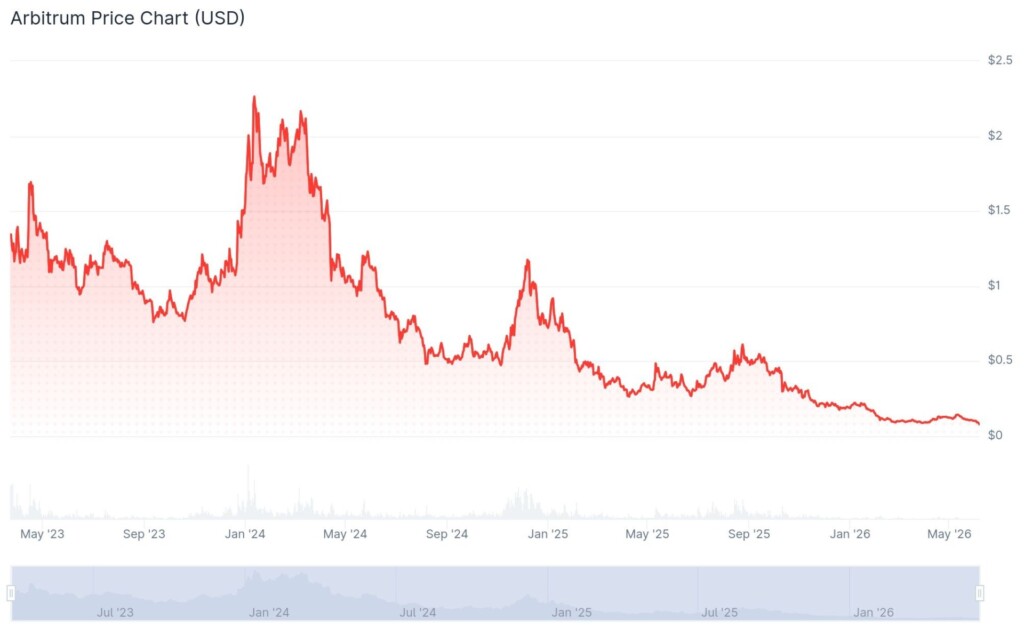 Arbitrum price history byCoinGecko
- The Arbitrum airdrop snapshot occurred on Feb 6, 2023, and eligible participants, including early users, started claiming arb tokens on Mar 23, 2023. The claiming period ended on Sep 24, 2023.
- The airdrop granted 11.5% of the total supply to eligible users, 1.1% to DAOs operating in the Arbitrum ecosystem, and 44% to employees and Offchain Labs investors. The 44% is subject to lock-up periods and a vesting schedule. The rest was sent to the Arbitrum DAO treasury.
- ARB is the native token of the network, with a total supply capped at 10 billion, annual inflation of 2%, and 12.75% of the supply initially distributed to eligible users and DAOs.
- A significant share of supply remains locked and is released gradually into circulation, potentially creating selling pressure if demand does not keep pace.
- On Sep 11, 2023, it fell to its all-time low at $0.7453.
- Bitcoin’s halving and the hype around crypto ETFs helped the coin recover from its October slump. By the end of the year, it had risen to $1.4.
- The run continued into 2024. On Jan 12, it reached its all-time high at $2.40.
- Per CoinMarketCap data, ARB broke below its listing price in June 2024.
- On August 5, 2024, it registered a new all-time low of $0.4317
- It then recovered in September, reaching a high of $0.67.
- The bullish run continued into November, reaching $1.12 in December.
- The Arbitrum network includes Arbitrum One for dApps that need stronger security and Arbitrum Nova for high-throughput use cases such as gaming and social apps.
- The coin crossed into 2025, trading at $0.72 when it assumed a bear run, falling to a low of $0.40 in February.
- It recovered later and crossed into October, trading at $0.45. The trend later reversed, and by date 11, it had fallen to $0.136.
- In December, it traded at $0.20.
- ARB then entered a bear market in 2026, and on Mar 30, 2026, it hit an all-time low of $0.08653.
- It later started recovering, and by May, it had crossed above $0.12. The trend reversed in June as it traded at $0.08.
- Competition from other blockchain projects and Ethereum L2 rivals such as Base, Optimism, and zkSync can affect Arbitrum’s market share and long-term price outlook.


 English (US)