

XRP price started a fresh decline below $2.920. The price is now consolidating losses and might continue to move down if it trades below $2.850.
- XRP price is slowly moving lower below the $2.920 pivot zone.
- The price is now trading below $2.950 and the 100-hourly Simple Moving Average.
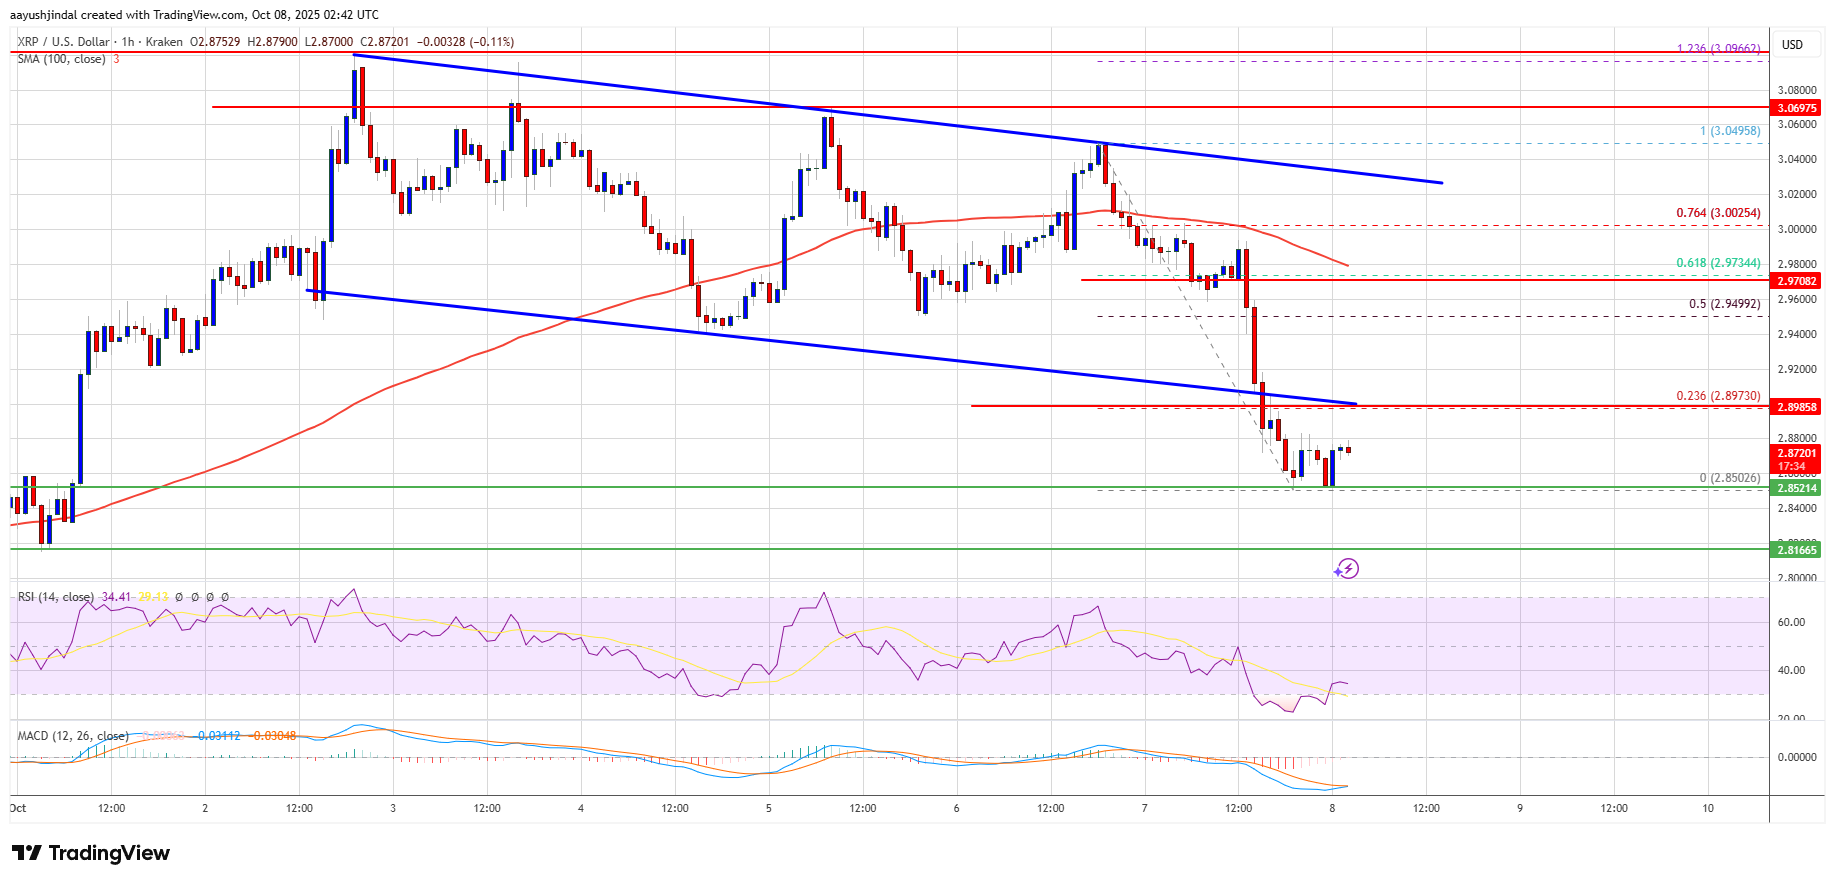
- There was a break below a key declining channel with support at $2.90 on the hourly chart of the XRP/USD pair (data source from Kraken).
- The pair could start a fresh decline if it settles below $2.850.
XRP Price Dips Again
XRP price failed to stay above $3.020 and started a fresh decline, like Bitcoin and Ethereum. The price declined below $3.00 and $2.950 to enter a short-term bearish zone.
Besides, there was a break below a key declining channel with support at $2.90 on the hourly chart of the XRP/USD pair. The price tested the $2.850 zone and is currently consolidating losses below the 23.6% Fib retracement level of the downward move from the $3.049 swing high to the $2.850 swing low.
The price is now trading below $2.920 and the 100-hourly Simple Moving Average. If there is a fresh upward move, the price might face resistance near the $2.90 level. The first major resistance is near the $2.950 level and the 50% Fib retracement level of the downward move from the $3.049 swing high to the $2.850 swing low.
A clear move above the $2.950 resistance might send the price toward the $3.00 resistance. Any more gains might send the price toward the $3.020 resistance. The next major hurdle for the bulls might be near $3.050.
Another Decline?
If XRP fails to clear the $3.00 resistance zone, it could start a fresh decline. Initial support on the downside is near the $2.850 level. The next major support is near the $2.80 level.
If there is a downside break and a close below the $2.80 level, the price might continue to decline toward $2.7250. The next major support sits near the $2.650 zone, below which the price could continue lower toward $2.60.
Technical Indicators
Hourly MACD – The MACD for XRP/USD is now gaining pace in the bearish zone.
Hourly RSI (Relative Strength Index) – The RSI for XRP/USD is now below the 50 level.
Major Support Levels – $2.850 and $2.80.
Major Resistance Levels – $2.90 and $2.920.


 English (US)