
 3 weeks ago
4215
3 weeks ago
4215

XRP’s ability to maintain its price above the $2.5 support level is now under threat, with technical indicators suggesting the asset is likely to correct.
In this case, the TD Sequential indicator, a tool known for predicting market turning points, has triggered a fresh sell signal, according to insights from cryptocurrency analyst Ali Martinez.
In an X post on October 29, the analyst noted that the TD Sequential has consistently identified trend reversals for XRP over the past three months.
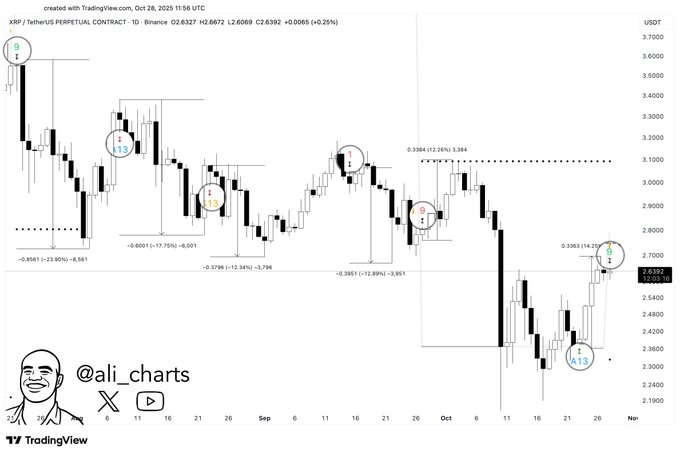 XRP price analysis chart. Source: TradingView
Each previous instance marked a notable shift in price momentum, often preceding sharp declines after local highs. The latest signal, appearing as XRP hovers near recent recovery levels, suggests the token could be approaching another correction phase.
Based on Martinez’s outlook, XRP has previously turned lower each time the TD Sequential signaled exhaustion, first near $0.74, then $0.68, and later around $0.62, each followed by substantial pullbacks. The current setup mirrors those past conditions, strengthening the bearish outlook.
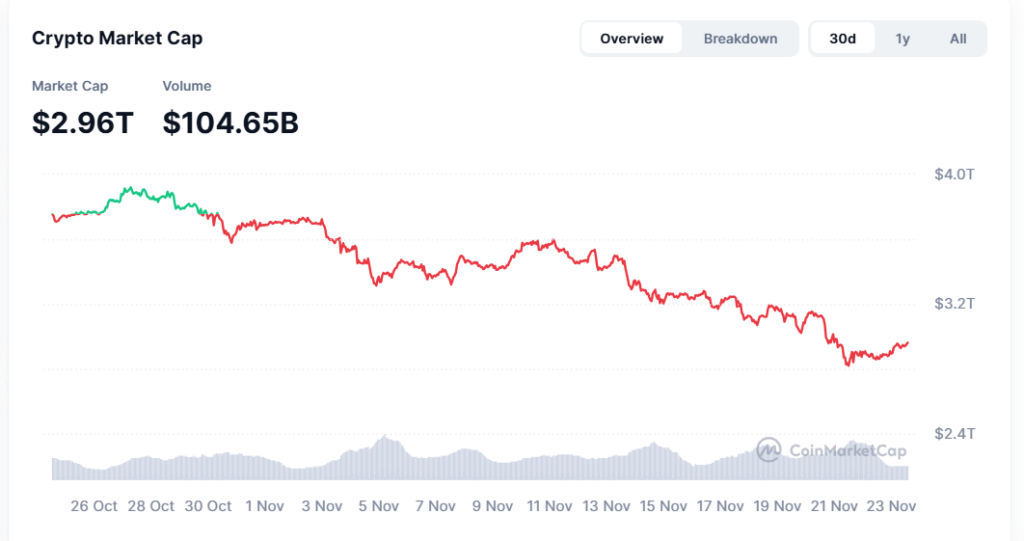
If historical accuracy holds, XRP could retreat toward the $2 psychological level, especially if selling pressure accelerates. Such a drop would align with the broader cryptocurrency market cooling.
Whales offloading XRP
Meanwhile, this technical warning is backed by whale activity, as large holders appear to be offloading.
Data shared by Martinez on October 28 indicated that despite XRP’s recent surge, whales took advantage of the price rebound to secure profits.
Addresses holding between 1 million and 10 million XRP collectively offloaded more than 140 million tokens in the past few days, signaling a potential cooling in momentum.
XRP price analysis
As of press time, XRP was trading at $2.63, having plunged 0.5% in the past 24 hours, while on the weekly timeframe, the token is up almost 10%.
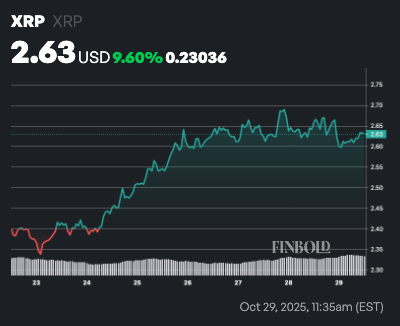 XRP seven-day price chart. Source: Finbold
Notably, at the current price, XRP is sitting right on its 200-day simple moving average (SMA), a level that often acts as a key indicator of long-term trend direction. However, the 50-day SMA at $2.79 remains above the current price, suggesting that short-term momentum is still weaker and the asset may face resistance around that zone.
On the other hand, the 14-day Relative Strength Index (RSI) stands at 51.69, signaling a neutral stance with neither overbought nor oversold conditions. This indicates that XRP is in a consolidation phase, where price direction could shift depending on whether bulls manage to reclaim the 50-day SMA or bears push it below the 200-day average.
Featured image via Shutterstock
The post XRP flashes major sell signal; Drop to $2 next? appeared first on Finbold.


![Crypto News Today [Live] Updates On November 19,2025](https://image.coinpedia.org/wp-content/uploads/2025/05/17173854/Coinpedia-Digest-Top-Crypto-News-This-Week-Hacks-Regulations-and-Institutional-Adoption-1-1024x536.webp)


 English (US)