
 1 month ago
7751
1 month ago
7751

XRP may be on the verge of a potential rebound after a key technical indicator flashed a buy signal on the four-hour chart, according to market analyst Ali Martinez.
In an X post on November 15, the analysis highlighted the TD Sequential indicator, a widely used tool for identifying trend exhaustion and potential reversal points.
Specifically, the indicator printed a “1” buy setup, which typically appears after a sequence of downward candles. This formation suggests fading bearish momentum and the early stages of a potential bullish reversal.
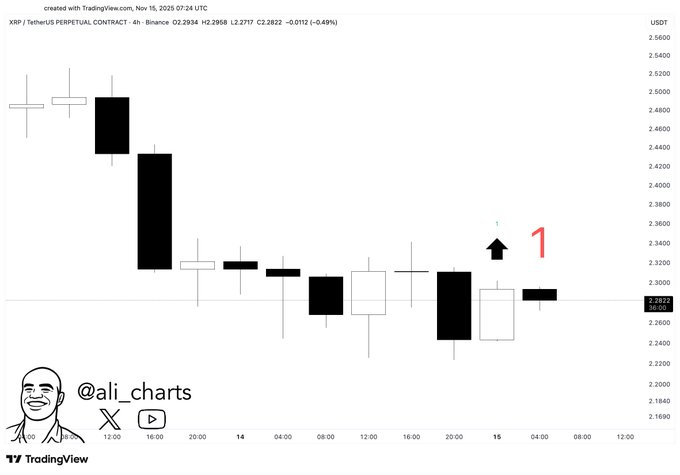 XRP price analysis chart. Source: TradingView
Notably, XRP has been under sustained selling pressure, marked by large black candles followed by smaller-bodied candles and indecisive price movement. This loss of downward strength culminated in the TD Sequential’s buy signal. The structure also suggests that sellers may be exhausted
If confirmed, the TD Sequential “1” could pave the way for a potential rebound, with bulls hoping for an early reversal from current levels. However, traders typically wait for further confirmation, often a “2” candle closing above the “1”, to validate sustained upward momentum.
XRP ETF impact
This outlook comes amid XRP’s growing institutional interest, highlighted by the debut of the first U.S. spot XRP ETF. In this case, Canary Capital’s spot XRP ETF made a historic debut on November 13, recording $58.6 million in first-day trading volume, well above the $17 million analysts had projected.
In its first 30 minutes, the ETF saw $26 million in trades, with a total of $245 million worth of XRP purchased on day one.
XRP price analysis
Despite this interest, XRP’s price is still being weighed down by broader cryptocurrency market sentiment. At press time, XRP was trading at $2.26, down over 2% in the past 24 hours.
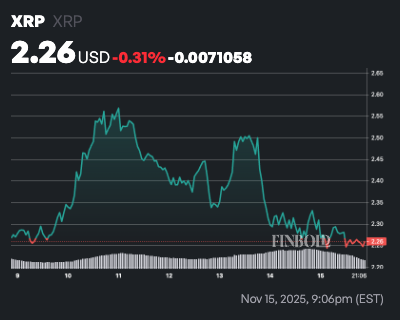 XRP seven-day price chart. Source: Finbold
On the weekly timeframe, the asset’s 14-day RSI stands at 42.4, signaling neutral momentum, neither overbought (above 70) nor oversold (below 30). This suggests limited immediate directional pressure and potential for sideways consolidation unless external catalysts emerge.
The 50-day SMA at $2.58 lies above the current price, indicating short-term resistance and a mild downward bias, while the 200-day SMA at $2.65 reinforces longer-term overhead pressure. As a result, XRP is positioned below both key trendlines, in a cautious, range-bound posture.
Featured image via Shutterstock
The post XRP flashes major buy signal; Imminent rebound? appeared first on Finbold.


 English (US)