

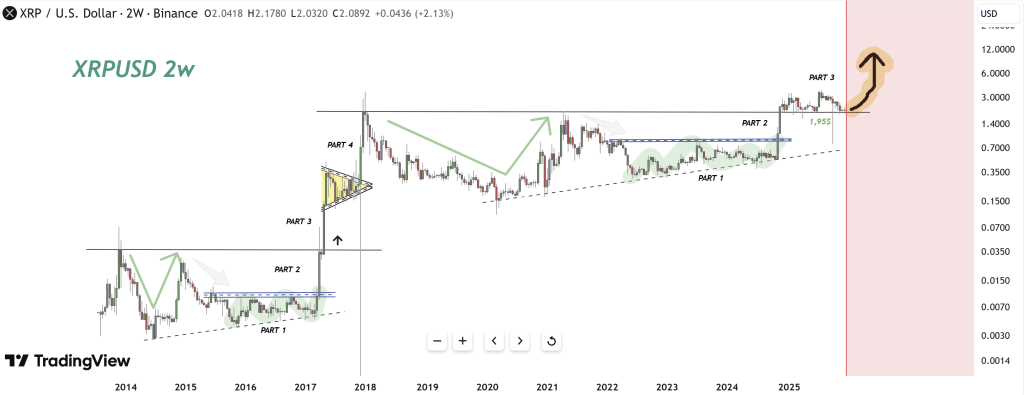
Crypto analyst Cryptollica published a new XRP/USD 2-week chart on December 8 via TradingView, arguing that the altcoin may be replaying the same structural pattern that preceded its explosive 2017 rally. With current price action pivoting around the key $1.95 level and technical targets projected as high as $9–$13.
What Happens If XRP Repeats The 2017 Fractal?
The analysis uses a long-range log chart from Binance, where the latest candle in the screenshot shows XRP trading around $2.0892. In this timeframe, the analyst divides XRP’s history into mirrored cycles: 2014–2017 on the left and 2021–2025 on the right, each broken into labeled segments “Part 1,” “Part 2” and “Part 3.”
According to Cryptollica, “the cycle experienced by XRP between 2014 and 2017 is almost an identical copy of the current cycle spanning 2021 to 2025.” In both cases, Part 1 is described as an accumulation phase, with XRP suppressed below a dashed blue resistance band for an extended period while forming higher lows along a rising dotted trendline.
The current Part 1, roughly 2022–2024, is said to have lasted substantially longer than in the earlier cycle. The analyst cites the rule that “the bigger the base, the higher in space,” arguing that this extended sideways structure signals a large build-up of potential energy.
Part 2 is defined as the breakout and retest of that blue resistance band. Once XRP closes decisively above this zone and consolidates there, the chart treats the area as a new support and as confirmation that “the official end of the downtrend and the start of a bull market” has been registered. Cryptollica suggests XRP is now at the final stage of, or has just completed, this breakout phase on the 2-week timeframe.
The pivotal reference point for the entire setup is the $1.95 level, drawn in green on the chart. “The $1.95 level, marked in green, is of vital importance,” the analyst writes, emphasizing the classic principle that “once resistance is broken, it turns into support.” In this framework, XRP “currently holding above this level (performing a successful retest) is the most crucial confirmation point for the continuation of the uptrend.”
If that confirmation holds, the analysis moves to Part 3, labeled the “Parabolic Rise – Discovery Phase.” In 2017, this segment corresponded to a near-vertical advance that pushed XRP into its all-time high zone. Cryptollica argues that XRP now stands “right on the precipice of this ‘vertical lift-off’ in the current cycle,” illustrated by a steep yellow arrow on the logarithmic chart. The first major objective is the region around the prior all-time high at roughly $3.30–$3.84. If the 2017 fractal “plays out precisely,” the post projects an “implied target” between $9.00 and $13.00.
The analyst tempers this with several cautions. The crypto market is far larger than in 2017, and a move to $10+ would imply a “colossal market capitalization,” making a repeat of the exact 2017 multiple “mathematically more challenging,” even if “logic often takes a backseat in crypto mania.” The scenario also assumes supportive fundamentals, including the resolution of regulatory overhangs, potential XRP ETF developments and Ripple’s stablecoin strategy.
Parabolic phases, Cryptollica warns, are typically accompanied by “sudden drops of 30–40%,” making them “the most dangerous territory for leveraged trading.” The analyst characterizes the overall outlook as “extremely positive (bullish)” as long as the $1.95 support holds, concluding that XRP is at the moment of “breaking its chains” and that, if broader market conditions remain constructive, “double-digit targets ($10+) for XRP are technically on the table.”
At press time, XRP traded at $2.07.


 English (US)