
 2 hours ago
483
2 hours ago
483

The post Will $6.45 Decide the Next Major Move for MYX Finance Price? appeared first on Coinpedia Fintech News
The MYX Finance price is gaining attention as early-year price action has been turning into a potential bullish setup, and on-chain tools are signaling improving market sentiment.
As already seen, following a strong January start, MYX Finance was consolidating in a symmetrical triangle until it, in the intraday session, broke out, hinting at strong accumulation beneath the surface while traders watch closely for a directional breakout in Q1 2026.
MYX Finance Price Structure Shows Early 2026 Accumulation
At the start of 2026, the MYX Finance price surged sharply, rising from $3.62 on January 1 to a monthly high of $7.32. However, rather than extending immediately, price action entered a consolidation phase between $4.80 and $6.20. This pause formed a well-defined symmetrical triangle on the MYX Finance price chart, often associated with accumulation during trend continuation phases.
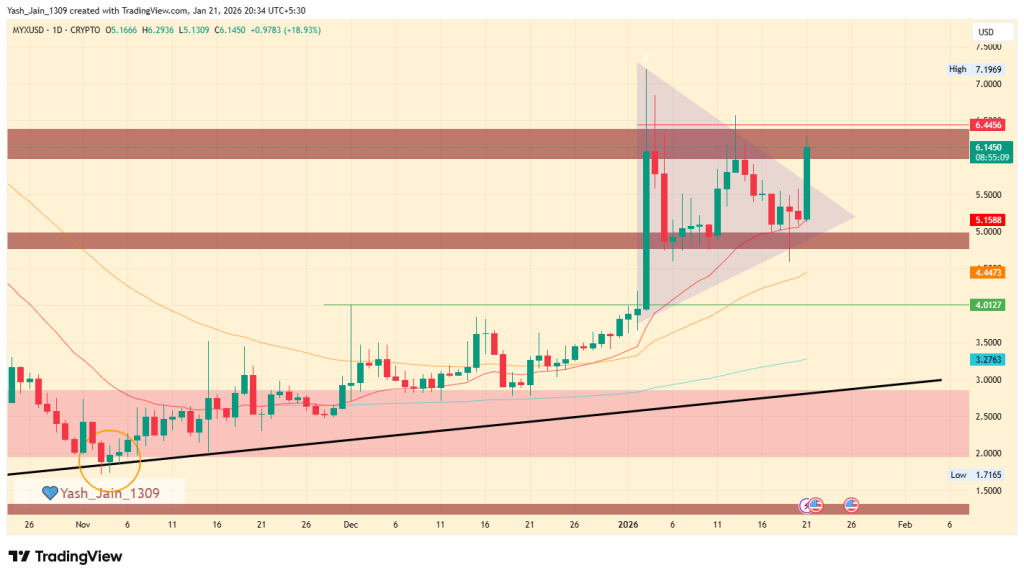
Moreover, this pattern reflected an active tug-of-war, but such sideways structures typically suggest positioning rather than distribution, particularly following a strong impulsive move.
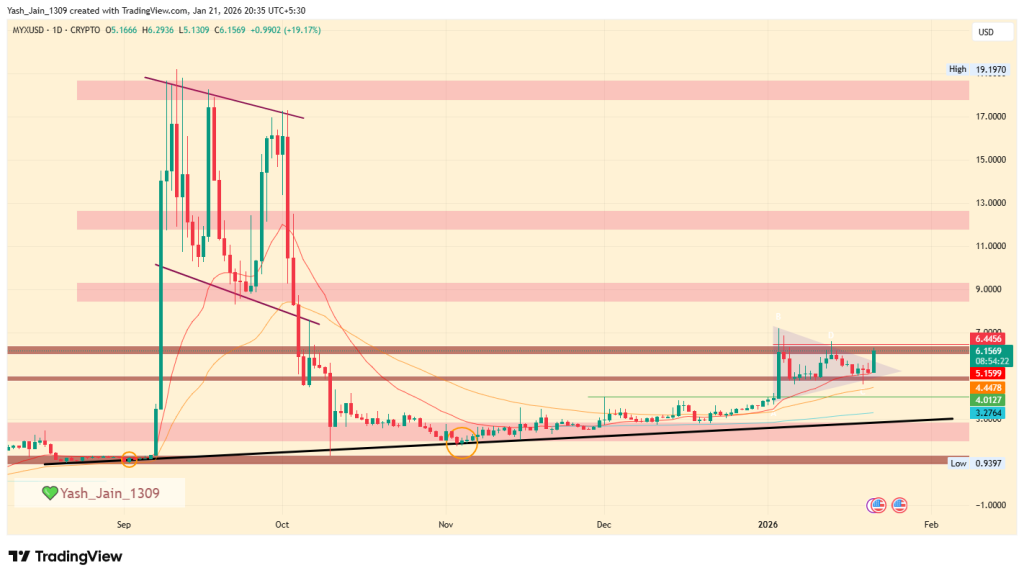
Key Resistance Levels Define the MYX Finance Price Forecast
From a technical standpoint, the $6.45 region stands out as the most immediate resistance. A sustained break above this zone could open the path toward $8.50 before the end of January 2026.
Conversely, downside risks still remain visible. If only bullish control weakens, a decline toward the rising trendline near $3.00-$3.50 could occur, extending the recovery timeline.
Nevertheless, current intraday strength, with MYX price reclaiming $6.20 and reaching a market cap near $1.55 billion, favors consolidation above key support rather than abrupt breakdowns.
On-Chain Signals Add Context to MYX Finance Crypto Momentum
Beyond price action, on-chain data provides deeper insight into market behavior. The rising MVRV Z-score suggests MYX Finance crypto is transitioning from an undervalued accumulation phase into a momentum-driven phase.
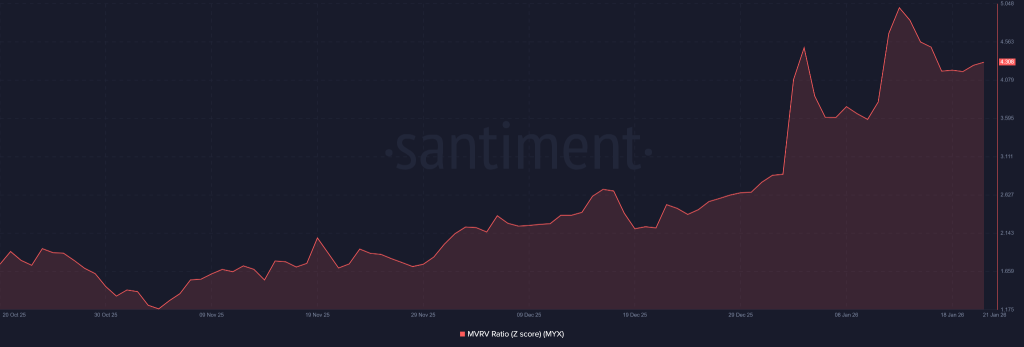
This shift suggests that market value is increasingly outpacing realized value, a dynamic often seen during the “belief phase” of bullish cycles.
Derivatives Activity Highlights Liquidity Pressure Zones
Derivatives data further complements the MYX Finance price forecast. Over the past 180 days, cumulative short liquidation leverage has increased against long liquidations, confirming heightened speculative activity. The strongest support rests near $4.04, where a breakdown could trigger liquidation of approximately $2.07 million in long positions.
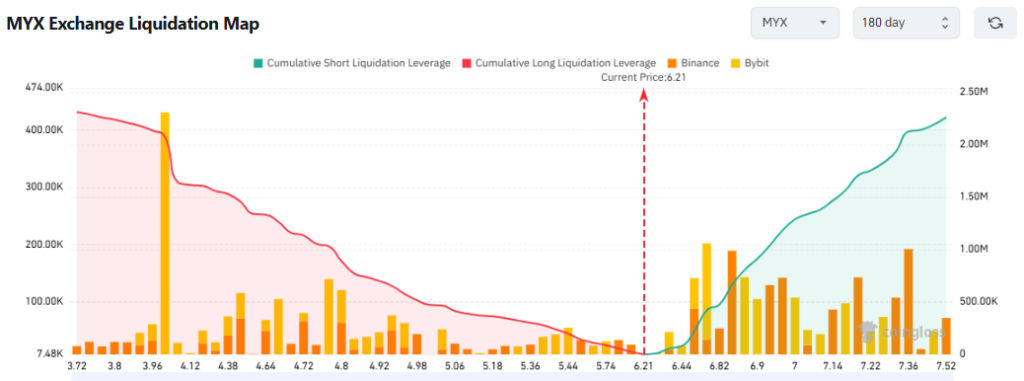
On the upside, clearing $6.45 and $6.88 could cascade into short liquidations worth $421,800, while a move above $7.36 may wipe out around $2.12 million in shorts.


 English (US)