
 3 months ago
11033
3 months ago
11033

Key Takeaways
- Liquity’s price projection suggests a peak of $0.87 by 2025.
- Traders may anticipate a range between a minimum of $2.5 and a maximum of $2.94 by 2028.
- Looking ahead to 2031, Liquity could potentially see a surge to $9.56.
Liquity, founded in 2021, is a decentralized borrowing protocol that enables users to take zero-interest loans, which are secured using Ether (ETH) as collateral. Unlike traditional lending platforms, Liquity allows users to mint its USD-pegged stablecoin, LUSD, without incurring interest, which is an appealing prospect in the DeFi space. The minimum collateral ratio in the protocol is 110% with the protocol having redemption fees that are algorithmically adjusted, offering a secure and low-cost borrowing experience, which is not available on other platforms. Liquity operates on a non-custodial basis, where users have full control over their collateral, and the Stability Pool and liquidation mechanisms provide security and strength..
The introduction of BOLD in late 2025 adds a new layer to Liquity’s ecosystem by incentivizing cross-chain liquidity and partnering with projects like Lagoon Finance to boost adoption. Despite challenges, such as market volatility and reliance on liquidity incentives, Liquity continues to innovate with projects like the BOLD Vault Launch and the unveiling of Liquity V2, positioning it for long-term growth potential in the next several years.
In this Liquity real-time price prediction and forecast, we will examine the price history, market sentiment, support and resistance levels, and major technical indicators to determine whether the future of Liquity will involve continued growth or a decline from 2025 to 2031. We will also assess the protocol’s ability to maintain BOLD’s peg and analyze how LQTY tokens might evolve within the competitive stablecoin ecosystem.
Overview
| Cryptocurrency | Liquity |
| Token | LQTY |
| Price | $0.4269 |
| Market Cap | $39.95M |
| Trading Volume 24-h | $19.63M |
| Circulating Supply | 95.46M LQTY |
| All-time High | $62.97 (Nov 16, 2021) |
| All-time Low | $0.5007 (Oct 11, 2025 ) |
| 24 High | $0.4619 |
| 24 Low | $0.4146 |
Liquity price prediction: Technical analysis
| Volatility | 6.23% |
| Sentiment | bearish |
| 50-Day SMA | $0.5722 |
| 200-Day SMA | $0.8200 |
| Price Prediction | $0.4667 (11.79%) |
| F & G Index | 11 (Extreme Fear) |
| Green Days | 15 / 30 (50%) |
| 14-Day RSI | 40.88 |
Liquity price analysis: LQTY price movement and market trends
Key Takeaways
- Liquity trades at $0.4269; the price has decreased by 6.46% in the past 24 hours.
- Market sentiment remains bearish as selling pressure continues.
- LQTY faces resistance near $0.47 and support around $0.41.
As of November 22, 2025, Liquity traded lower as the market extended its decline. The token moved to $0.4269 after dropping from the daily high of $0.4619, while the 24-hour low was reached at $0.4135. The latest candle remained red, indicating pressure from sellers across the session. The day-to-day range kept reducing with the lower band of the chart.
Liquity analysis on the Daily Chart
The one-day chart for Liquity showed a continued downward trend, with LQTY falling 6.46% over the last 24 hours to trade at $0.4269.The fall in Liquidity continued to maintain the price at levels lower than it was previously in early November, indicating low demand. Community sentiment stood at 85% bullish, but the sentiment had not affected the price movement.
The Relative Strength Index on the one-day chart stood at 40.20, with the signal line at 42.62. This is a sign of weakening momentum. The RSI curve maintained a downward slope, suggesting selling activity remained stronger than buying. A move closer to the 30 zone could push Liquity near oversold conditions.
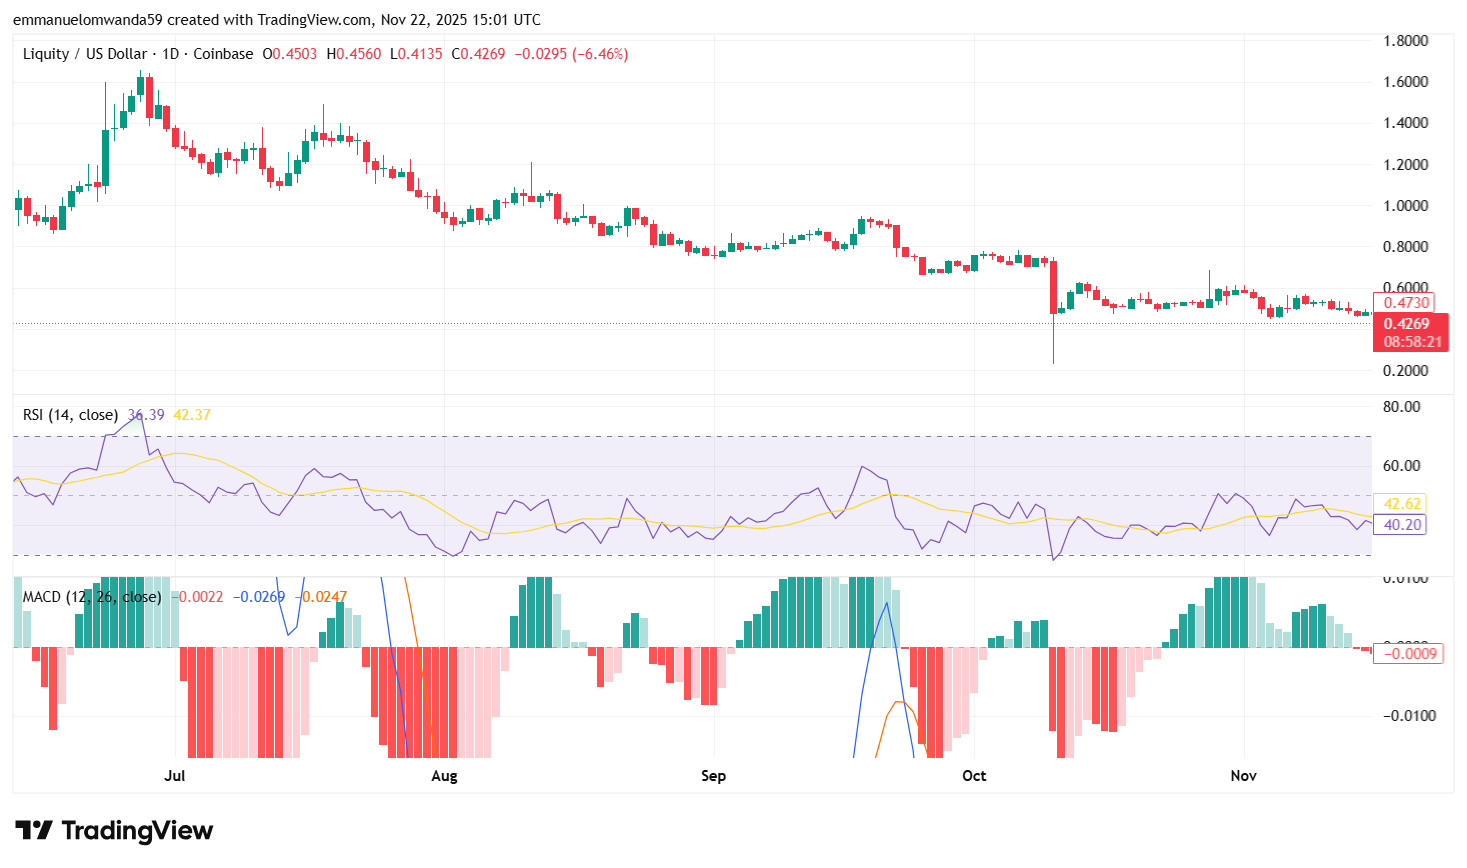 LQTY/USDT Chart: TradingView
 The MACD line sat near –0.0009, and the histogram showed almost no expansion. This reflects a trend with little positive momentum. The indicator aligned with the broader bearish sentiment seen throughout November.
LQTY market cap stood at $39.95M, while trading volume reached $19.63M. Despite the activity, the price held near the lower boundary of its recent consolidation zone. The nearest resistance $0.47, while support is around $0.41 after several intraday retests.
Liquity 4-hour price chart
The 4-hour Liquity chart shows LQTY trading at $0.4250, recovering slightly by 0.33% after touching a session low near $0.4143.The trend on a short-term basis is also weak as the latest candles have been recording lower highs and lower lows throughout the period.
The Relative Strength Index of the 4-hour chart stands at 33.87, and the signal line is at 40.67. The RSI is still in the lower half and the lower band, indicating that the selling momentum controls the short-term structure and has still not reached the oversold range. The downward slope of the RSI reflects continued pressure on the price.
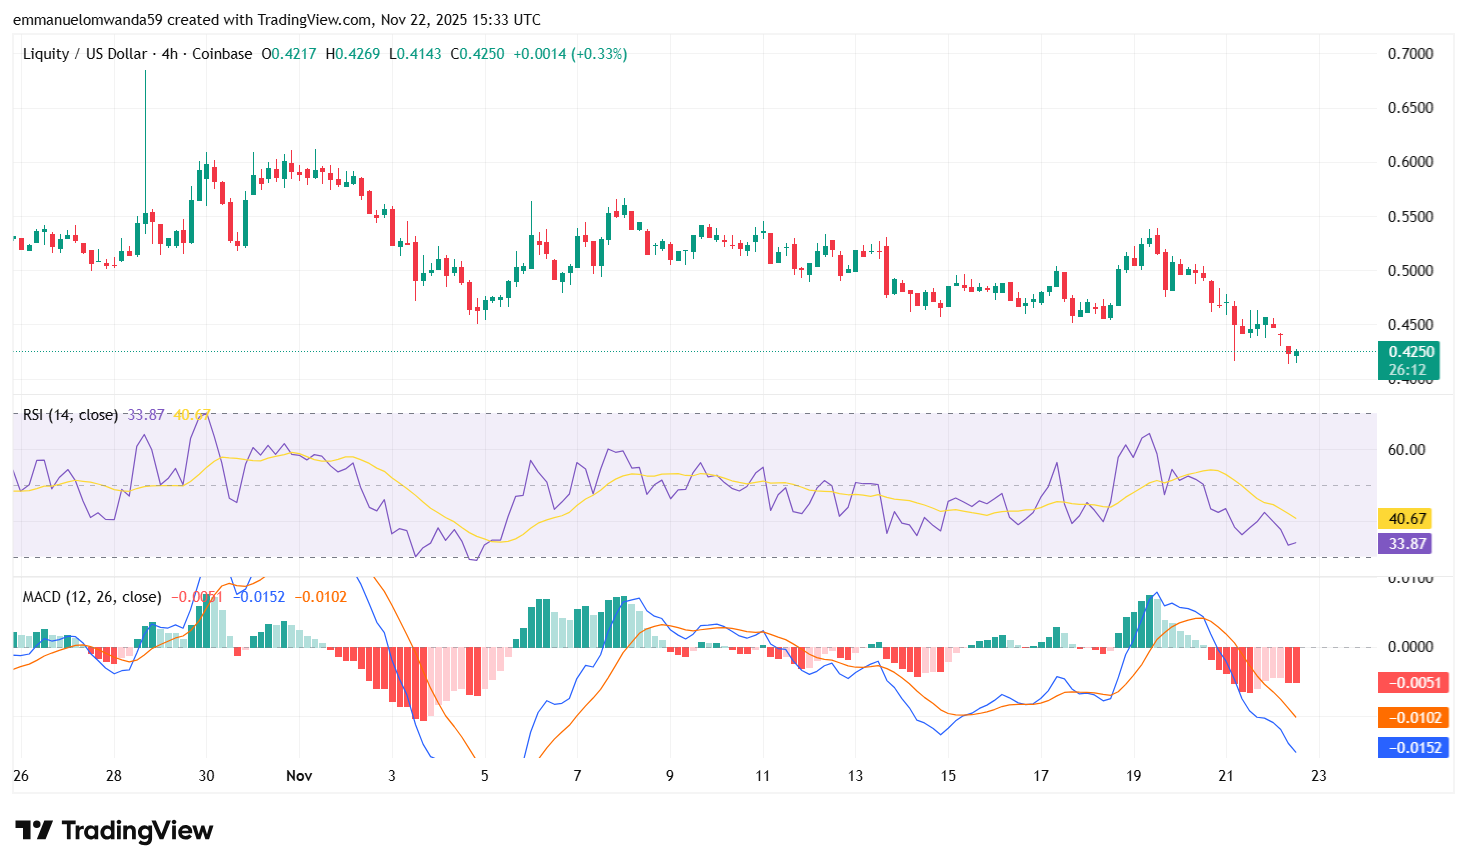 LQTY/USDT Chart: TradingView
 The MACD line is positioned at –0.0152, while the signal line is at –0.0102, with a histogram reading of –0.0051. The lines remain spread apart, and both move below zero, indicating sustained bearish momentum. Recent red histograms show that sellers continue to control the market.
Price action on the chart shows liquidity concentrated around the $0.42 and $0.43 zone, where several candles have attempted support. The overhead resistance is centred around $0.45, which Liquity has not been able to regain in various attempts this week. In case the current range is retained, the upcoming support will be situated close to $0.41, which was the bottom of the previous period.
Resistance forms around $0.45, a level that Liquity has failed to reclaim across multiple tests this week. If the current range holds, the next support sits near $0.41, which marked the lower boundary in earlier sessions.
Liquity technical indicators: Levels and actions
Daily simple moving average (SMA)
| Period | Value | Action |
| SMA 3 | $0.5842 | SELL |
| SMA 5 | $0.5551 | SELL |
| SMA 10 | $0.5450 | SELL |
| SMA 21 | $0.5418 | SELL |
| SMA 50 | $0.5722 | SELL |
| SMA 100 | $0.6912 | SELL |
| SMA 200 | $0.8200 | SELL |
Daily exponential moving average (EMA)
| Period | Value | Action |
| EMA 3 | $0.5221 | SELL |
| EMA 5 | $0.5611 | SELL |
| EMA 10 | $0.6387 | SELL |
| EMA 21 | $0.7416 | SELL |
| EMA 50 | $0.8798 | SELL |
| EMA 100 | $0.9506 | SELL |
| EMA 200 | $0.9931 | SELL |
What to expect from the Liquity price analysis next?
Liquity is likely to remain under short-term bearish pressure as long as the price holds below the $0.45 resistance and momentum indicators stay weak. If LQTY fails to defend the $0.41 support, the chart suggests a possible retest of lower levels, while any recovery attempt would require a decisive 4-hour close back above $0.45.
Why is the Liquity price down today?
Liquity (LQTY) fell today as weak technical momentum pushed the token below key support levels while trading volume continued to drop. The decline was compounded by lower protocol activity and broader altcoin risk-off sentiment driven by rising Bitcoin dominance.
Is LQTY a good investment?
The Liquity protocol has been gaining popularity in the DeFi space due to its low transaction fees, fast transaction times, and the ability for users to borrow without needing to provide collateral. Liquity has also been recognized for its innovative use of smart contracts and its ability to provide liquidity to users without relying on intermediaries.
As with any cryptocurrency, predicting the price of Liquity can be challenging due to the volatility of the crypto market. However, many experts in the industry believe that the potential for Liquity’s growth is significant.
Will LQTY reach $2?
Yes, according to the long-term predictions, Liquity is projected to reach up to $2 by 2027.
Will LQTY reach $5?
Yes, according to the long-term predictions, Liquity is projected to reach up to $5 by 2030.
Will LQTY reach $10?
Yes, LQTY is projected to reach $10. In several years, the highest price prediction is $9.56, suggesting that LQTY has the potential to achieve this milestone after 2031.
Recent news/opinions on the LQTY
Upshift and Clearstar Labs introduced a dual-asset vault for BOLD/USDC deposits that provides around 10% APR and grants access to Liquity-fork airdrops. The setup simplifies passive yield for BOLD holders but ties returns to the performance and emissions of fork tokens.
Does LQTY have a good long-term future?
LQTY has long-term potential due to its decentralized, interest-free borrowing model and the use of LUSD, a fully algorithmic stablecoin. The protocol’s immutability and revenue-sharing mechanism for stakers enhance its appeal. However, it faces challenges like competition from larger DeFi platforms such as Aave and MakerDAO, as well as market volatility affecting adoption.
Liquity price prediction December 2025
LQTY price prediction for December 2025 expects a minimum value of $0.42 with an average price of $0.62. The price could reach a maximum of $0.82 during the month.
| Month | Minimum Price | Average Price | Maximum Price |
| December | $0.42 | $0.62 | $0.82 |
Liquity price prediction 2025
According to the Liquity coin price prediction for 2025, we expect a minimum price of $0.4 and an average price of $0.65. However, if LQTY’s growth trajectory persists, its value could reach as high as $0.87.
| Year | Minimum Price | Average Price | Maximum Price |
| 2025 | $0.4 | $0.65 | $0.87 |
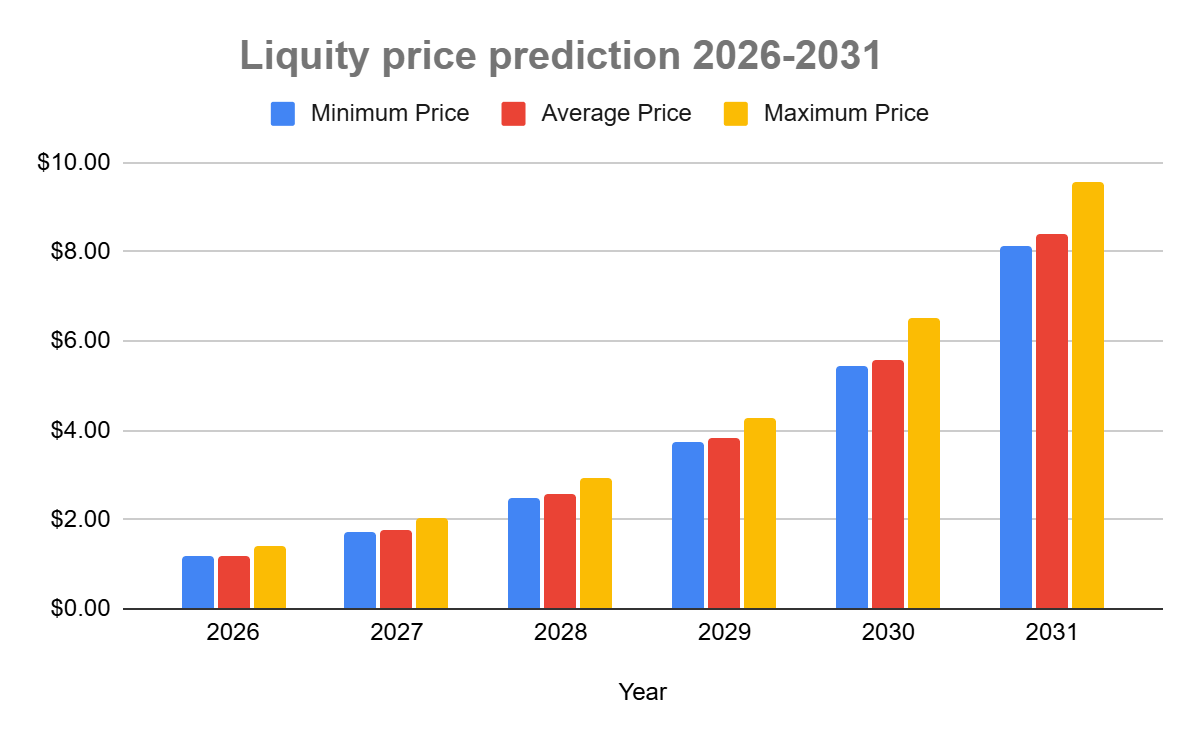
Liquity price prediction 2026-2031
| Year | Minimum Price | Average Price | Maximum Price |
| 2026 | $1.17 | $1.2 | $1.39 |
| 2027 | $1.71 | $1.77 | $2.04 |
| 2028 | $2.5 | $2.59 | $2.94 |
| 2029 | $3.73 | $3.84 | $4.27 |
| 2030 | $5.42 | $5.58 | $6.53 |
| 2031 | $8.14 | $8.42 | $9.56 |
Liquity Price Prediction 2026
According to the Liquity LQTY price prediction for 2026, we expect a minimum price of $1.17 and an average price of $1.2. However, if Liquity LQTY’s growth trajectory persists, we predict its value could reach as high as $1.39 at its peak.
Liquity Price Prediction 2027
According to the Liquity forecast for 2027, the minimum price of LQTY will be $1.71, while the average price will be around $1.77. There is potential for significant growth in the value of Liquity LQTY during this period, with the token possibly reaching a maximum price of $2.04 by the end of 2027.
Liquity Price Prediction 2028
According to the price prediction for 2028, we expect the minimum price of the coin to be $2.5 and an average predicted value of $2.59. We expect LQTY’s price to surge to a maximum of $2.94 by 2028.
Liquity Price Prediction 2029
The Liquity LQTY price prediction for 2029 is a minimum value of $3.73 with an average trading price of $3.84. Based on this prediction, the price could reach a maximum of $4.27 during the year.
Liquity Price Prediction 2030
Based on the Liquity LQTY price prediction for 2030, the LQTY token is anticipated to experience a bullish trend with a predicted floor price of $5.42 and an average trading value of $5.58. The highest possible price for 2030 is estimated to reach $6.53, reflecting a significant increase in the token’s valuation.
Liquity Price Prediction 2031
The Liquity LQTY price prediction for 2031 suggests that the algorithmically adjusted redemption minimum price level could be $8.14. The LQTY token will experience significant growth, with a maximum potential price value of $9.56 and an average projected value of $8.42.
 Liquity Price Prediction
Liquity market price prediction: Analysts’ LQTY price forecast
| Firm | 2025 | 2026 |
| Coincodex | $0.7988 | $3.78 |
| Digital Coin Price | $1.74 | $1.99 |
Cryptopolitan’s Liquity price prediction
According to Cryptopolitan’s Liquity price forecast, LQTY could reach a maximum price of $0.87 by the end of 2025. By 2026, the price of the LQTY token is predicted to reach a minimum value of $1.39.Liquity ’s rise in price could take it to a maximum price level of $9.56, with an expected average trading price of $8.42 by 2031.
LQTY historic price sentiment
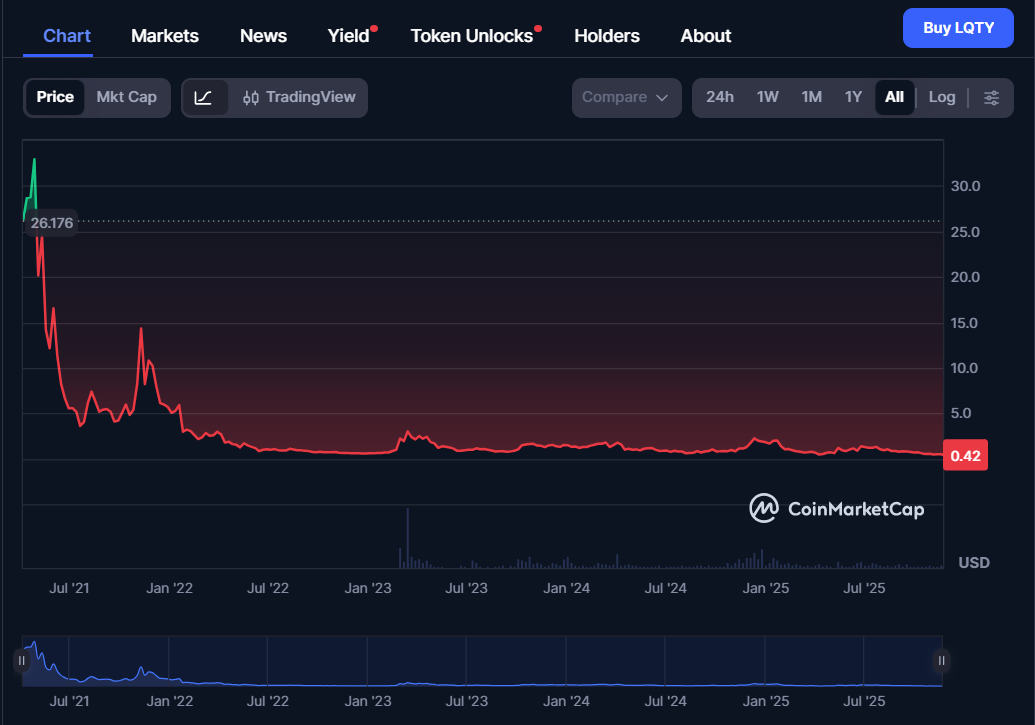 Liquity Price History
- Regarding the lowest prices, November 13, 2022, had the lowest price of $0.533, while November 16, 2021, had the highest price of $62.97.
- Liquity had its bull run in 2021 before the 2022 crypto winter kicked in. In 2023, it maintained losses below its opening price.
- Binance announced on February 28, 2023, that it would list Liquity (LQTY) tokens in its innovation zone and make them available as a borrowable asset in its isolated margin account.
- In April 2024, LQTY traded between $0.80 – $0.90, showing a slight increase, but there was no significant trend change.
- A minor increase toward $0.90 happened, possibly due to short-term trading activity, but it didn’t lead to a breakout as of June 2024.
- In September 2024, Small volatility was seen, but the price still hovered between $0.80 – $0.85.
- The year ended with the price around $0.80, showing a lack of major bullish movement.
- In January 2025, no major changes, with LQTY still trading at $0.80.
- In February 2025, Slight fluctuations between $0.80 – $0.85, but no strong price recovery.
- As of March 2025, the price remained weak, staying near $0.80, showing continued low demand.
- In April 2025, LQTY began slipping below the $0.80 zone as market sentiment weakened further.
- In May 2025, the price continued trading downward, moving into the mid$0.60 range with little buyer support.
- In June 2025, selling pressure increased, pushing LQTY into the low $0.60 levels and signaling deeper market exhaustion.
- In July 2025, the decline accelerated as the token dropped toward the $0.50 region amid broader DeFi weakness.
- In August 2025, LQTY fell sharply, sliding into the $0.35–$0.40 zone and showing strong bearish momentum.
- In September 2025, the token inched closer to the $0.30 mark as liquidity thinned and demand remained low.
- In October 2025, Liquity reached its all-time low of $0.2536 on October 11, 2025, before rebounding slightly later in the month.
- In November 2025, LQTY recovered by over 60% from its bottom, trading around $0.42, but remained far below its earlier yearly levels.


 English (US)