
 1 month ago
9047
1 month ago
9047

Although Ethereum (ETH) is witnessing sustained downward pressure, causing the asset to drop below $3,000, technical indicators suggest the cryptocurrency might be building for a short-term rebound.
This outlook was presented by popular cryptocurrency analyst TradingShot, who in a TradingView post on November 18 pointed out that the rebound potential can be traced back to last month’s performance.
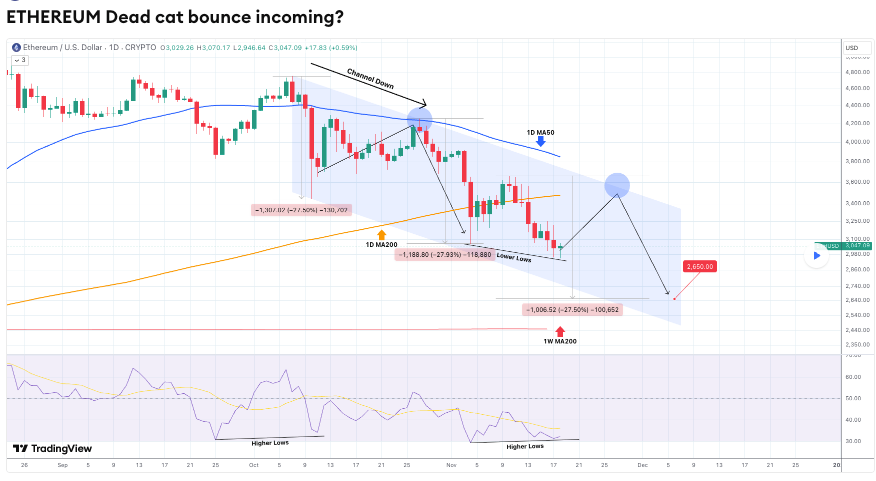 ETH price analysis chart. Source: TradingView
Since early October, ETH has been trading within a descending channel, experiencing two consecutive bearish legs, each declining roughly 27.5%. This ongoing trend has kept Ethereum below key technical levels, reflecting broader market caution among investors.
The analyst highlighted the one-day Relative Strength Index (RSI) as a potential signal for a temporary recovery. The RSI is forming higher lows while the price continues to make lower lows, creating a bullish divergence.
This pattern mirrors similar price behavior observed in early October and suggests that a short-term bounce could occur. Such a rebound might push Ethereum toward the one-day 50-day moving average, which previously acted as resistance in late October, offering a key test point for market participants.
Despite this potential uptick, the medium-term outlook remains bearish. TradingShot projects that Ethereum will likely complete its current downward leg before any sustained recovery, with a projected target near $2,650.
Key ETH price levels to watch
Meanwhile, another analysis by crypto analyst Daan Crypto Trades identified key price levels to watch. He noted that $2,800 and $4,100 remain significant support and resistance zones that have shaped price action over the last two years.
In the short-to-medium term, the $3,350 area, which marked the August low and recently acted as support, could also play a role in upcoming market moves.
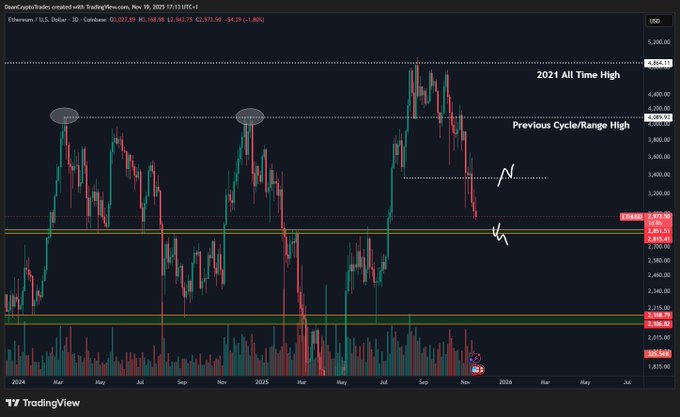 ETH price analysis chart. Source: TradingView
ETH price analysis
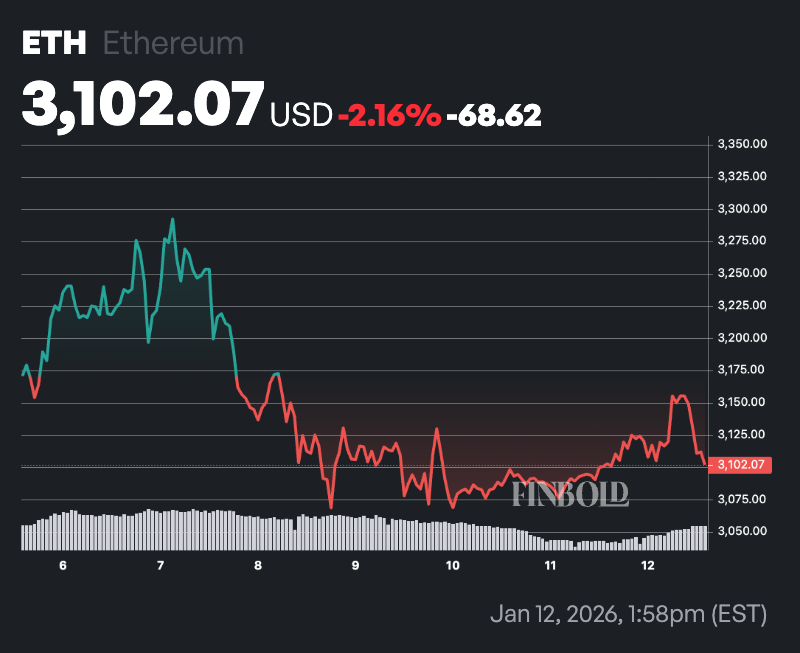
By press time, Ethereum was trading at $2,921, having collapsed over 7% in the past 24 hours and nearly 15% over the past week.
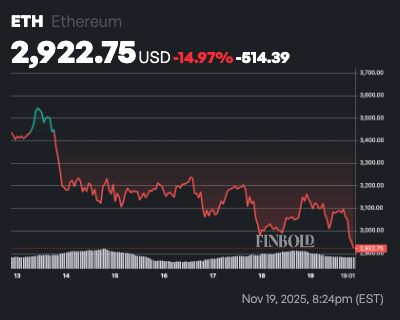 ETH seven-day price chart. Source: Finbold
Currently, the asset is tilting toward the bearish side. Notably, the 50-day SMA sits at $3,817, signaling short-term weakness as the price trades roughly 19% below this level, a downtrend indicator where sustained closes underneath suggest further downside risk unless momentum shifts.
In contrast, the 200-day SMA, around $3,719, offers a milder buffer. Ethereum’s position just below it hints at medium-term vulnerability but avoids a full “death cross” confirmation, potentially stabilizing if buyers defend this threshold.
Featured image via Shutterstock
The post Ethereum set for a ‘dead cat bounce’, says expert appeared first on Finbold.


 English (US)