

A recent technical analysis shared on X by crypto analyst Merlijn The Trader presents Ethereum’s price action on the 2-day candlestick chart as a textbook example of Wyckoff accumulation. In his assessment, Ethereum has already moved through several key stages of the model and is now approaching a powerful expansion phase, provided the structure stays intact.
Wyckoff Accumulation Structure Taking Shape On Ethereum Chart
Over the past several days, Ethereum has traded between roughly $3,050 and $3,400, repeatedly failing to secure a sustained move beyond either boundary. At the time of writing, Ethereum’s price action is trading around $3,100.
This prolonged standoff has reinforced the view that Ethereum has returned to consolidating rather than trading in a defined trend, a behavior that aligns closely with the accumulation phase highlighted in a technical analysis by Merlijn The Trader.
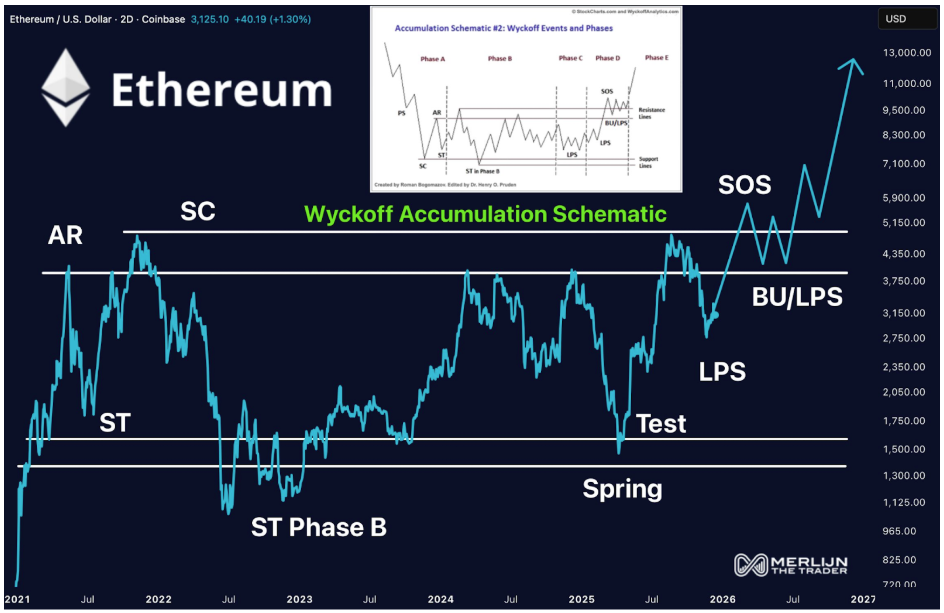
In his post, Merlijn described Ethereum’s chart as a “Wyckoff masterclass,” pointing to a sequence of events that align with textbook behavior from the Wyckoff accumulation schematic, which have been playing out for the entirety of 2025.
According to the annotated structure, the spring occurred when ETH briefly dipped below $1,500 in the first half of the year. Price did not linger below that level for long, reclaiming the range within days and going on a rally that eventually ended at a selling climax (SC) of $4,946
Within this structure, the initial selling climax and automatic downtrend reaction established a clear range in which the cryptocurrency has been trading up until now. The chart labels show this as Ethereum moving through Phase D, and this has been highlighted by a downtrend in recent months.
However, based on the Wyckoff framework, Ethereum seems to now be approaching the breakout zone, with a transition into a full Phase E and a potential vertical markup coming next if the structure continues to play out.
Phase E Projection Points To Strong Upside Scenario
If the Wyckoff roadmap continues to unfold as outlined, Merlijn believes Ethereum is setting up for a full Phase E, the final stage of the accumulation process. This phase is characterized by a sustained markup, where price exits the selling climax (SC) decisively and trends higher with increasing momentum.
Ethereum / US Dollar: @MerlijnTrader on X
The projection on the chart shows a sharp upside expansion once overhead resistance is cleared, with Merlijn pointing to $10,000 and higher as a long-term objective if the structure completes. The path higher is not expected to be linear. The model anticipates an initial push into new all-time highs, followed by a modest rejection around the $5,000 area before the price pauses to consolidate towards the Backup and Last Point of Support
According to the chart, this BU/LPS would likely form around $3,750. If Ethereum holds above that level during the pullback, it would confirm structural strength, with the subsequent expansion targeting above $10,000.
Featured image from Unsplash, chart from TradingView


 English (US)