

Dogecoin is facing another bearish technical call after trader Cheds Trading (@BigCheds) posted a weekly DOGE/USD chart via X on Feb. 24 and said the memecoin “looks headed for 6 cents .06 range.” The setup matters because the chart he shared shows DOGE already trading below a stack of key weekly trend indicators, with the next widely visible support region lower.
Is Dogecoin Heading To $0.06?
Cheds’ comment was brief and direct: “DOGE looks headed for 6 cents .06 range”. The TradingView chart is a 1-week DOGE/USD Coinbase chart. The chart’s indicator panel shows DOGE trading below all the visible moving averages cited on the screenshot.
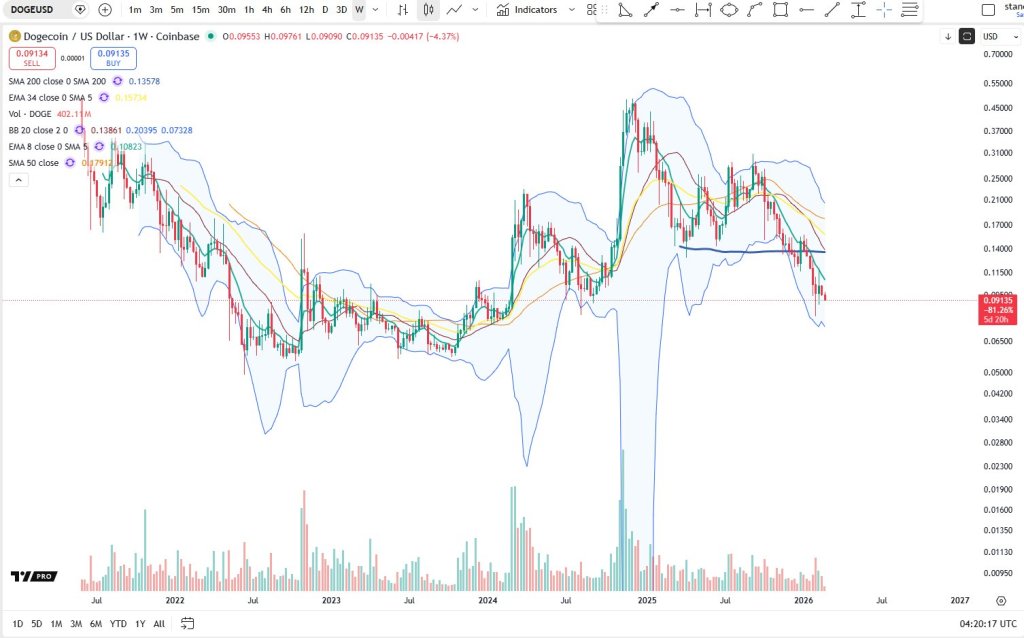
The EMA 8 is marked at $0.10823, the SMA 200 at $0.13578, the EMA 34 at $0.15734, and the SMA 50 at $0.17912. With price at $0.09135, DOGE is beneath each of those levels, which supports the analyst’s argument that the weekly structure remains weak unless price can reclaim them.
The Bollinger Bands shown on the same chart also provide context. The screenshot lists BB 20 (2) values at $0.13861 (basis), $0.20395 (upper band), and $0.07328 (lower band). That places DOGE closer to the lower band than the midline and well below the basis, consistent with downside pressure on the weekly timeframe.
Cheds’ $0.06 target would also imply a move below the currently displayed lower Bollinger Band level of $0.07328, which frames the call as a deeper continuation scenario rather than a simple drift within the current volatility envelope. From the displayed close of $0.09135, a move to $0.06 would represent roughly another 34% downside.
The chart shows continued low trading volume, with price continuing to slide after failing to hold higher levels visible earlier in the cycle. In practical terms, the chart Cheds shared supports a straightforward thesis: DOGE is below near-term and medium-term trend references, and the burden of proof remains on buyers.
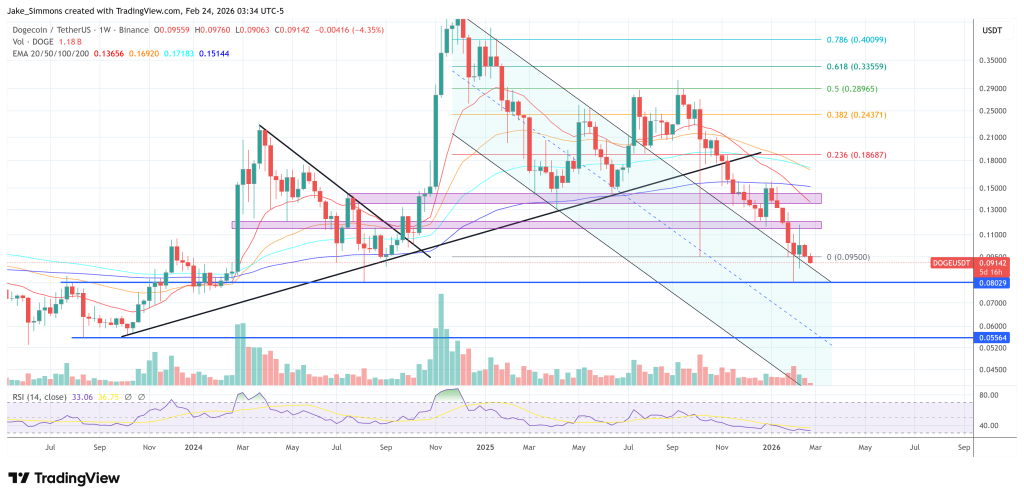
Unless DOGE can reclaim some of those weekly indicator levels, starting with the EMA 8 at 0.10823, the analyst’s call for a retest toward the $0.06 area remains aligned with the chart structure shown. Notably, DOGE has fallen below the October 10 crash low at $0.095. The next support could be near $0.08, a price DOGE visited already three weeks ago. The price also marked the August 2024 bottom.
At press time, DOGE traded at $0.09142.


 English (US)