
 4 weeks ago
5850
4 weeks ago
5850

Key Takeaways
- DigiByte is predicted to reach a minimum and maximum value of $0.00580 and $0.00673, respectively, in 2025.
- In 2028, the DGB price is expected to reach a maximum value of $0.0235, with an average value of $0.0195.
- The price of DigiByte is predicted to reach an average value of $0.0403 in 2030
DigiByte (DGB) is an open-source blockchain launched in 2014 as a fork of Bitcoin. It was created by Jared Tate and operates on a fully decentralized, community-driven model. DigiByte had no ICO and has no central company. Development is supported by volunteers and the DigiByte Foundation.
The network focuses on speed, security, and scalability. DigiByte uses five mining algorithms and a multi-layer architecture. It can generate blocks at an interval of 15 seconds and is capable of handling thousands of transactions per second. This renders it appropriate for micropayments and daily payments. DigiByte became the first blockchain to have Segregated Witness (SegWit).
DGB has a fixed supply of 21 billion coins, expected to be fully issued by 2035. In May 2021, the price reached an all-time high of $0.1825 before falling sharply later that year. Despite this decline, long-term holders remain committed due to its security, technology, and strong community.
In this DigiByte price prediction, we examine the short-term price potential of DigiByte by reviewing current market conditions, key support and resistance levels, and major technical indicators. The outlook through 2025–2031 also reflects the impact of adoption, partnerships, governance, and broader crypto market trends on DigiByte’s future price direction.
Overview
| Cryptocurrency | DigiByte |
| Token | DGB |
| Price | $0.00572 |
| Market Cap | $106.84M |
| Trading Volume | $8.98M |
| Circulating Supply | 18.05B DGB |
| All-time High | May 01, 2021 $0.1825 |
| All-time Low | Dec 20, 2014 $0.00002028 |
| 24-hour High | $0.006495 |
| 24-hour Low | $0.005382 |
DigiByte Price Prediction: Technical Analysis
| Price Prediction | $ 0.006351 (0.65%) |
| Volatility | 10.62% (Very High) |
| 50-Day SMA | $0.007323 |
| 14-Day RSI | 43.99 (Neutral) |
| Sentiment | Bearish |
| Fear & Greed Index | 16 (Extreme Fear) |
| Green Days | 13/30 (43%) |
| 200-Day SMA | $ 0.008097 |
DigiByte Price Analysis
- DigiByte price analysis shows a bearish consolidation near $0.00582.
- DGB is down by 0.14% over the past 24 hours.
- Key support is around $0.00575, while immediate resistance stands near $0.00600.
On December 16, 2025, DigiByte price analysis indicated continued bearish pressure. The price declined to $0.00582 in the past 24 hours after facing strong rejection near the $0.00660 region earlier this month. DigiByte’s market cap stands at approximately $106.84 million, and the current DigiByte price showed a loss of 0.14% in value in the last 24hours, as selling pressure intensified around overhead resistance. Immediate resistance for DGB is present near $0.00600, while sellers continue to defend higher levels, limiting upside attempts.
Digibyte 24-hour chart analysis
The one-day price chart for DigiByte confirms a downward trend in the market. The digibyte network price is near the $0.00582 level as bearish momentum persists. Consecutive red candlesticks on the chart highlight sustained selling activity and weak buyer participation.
The Relative Strength Index (RSI) is trending in the lower neutral region. The indicator’s value is recorded at 39.85, remaining below its moving average near 40.15. The flattened RSI curve suggests weak buying interest, with no strong reversal signals forming yet.
 DGB/USDT Chart: TradingView
The Moving Average Convergence Divergence (MACD) remains in bearish territory. The MACD line stands at -0.00035, positioned below the signal line at -0.00037. The histogram reflects muted bearish momentum, indicating consolidation rather than a strong recovery.
DigiByte 4-hour chart
On the 4-hour chart, DigiByte (DGB) continues to trade under bearish pressure, moving near $0.00575 after failing to hold recent day gains. The price attempted a recovery but was quickly rejected near the $0.00600 area, reinforcing strong resistance and keeping sellers in control. The price action remains range-bound with a bearish bias.
The Relative Strength Index (RSI) on the 4-hour timeframe is currently at 44.11, remaining below the neutral midpoint of 50 and slightly above its moving average at 42.13. This positioning suggests mild stabilization but insufficient buying momentum to support a meaningful upside move. RSI remains subdued, indicating cautious market participation.
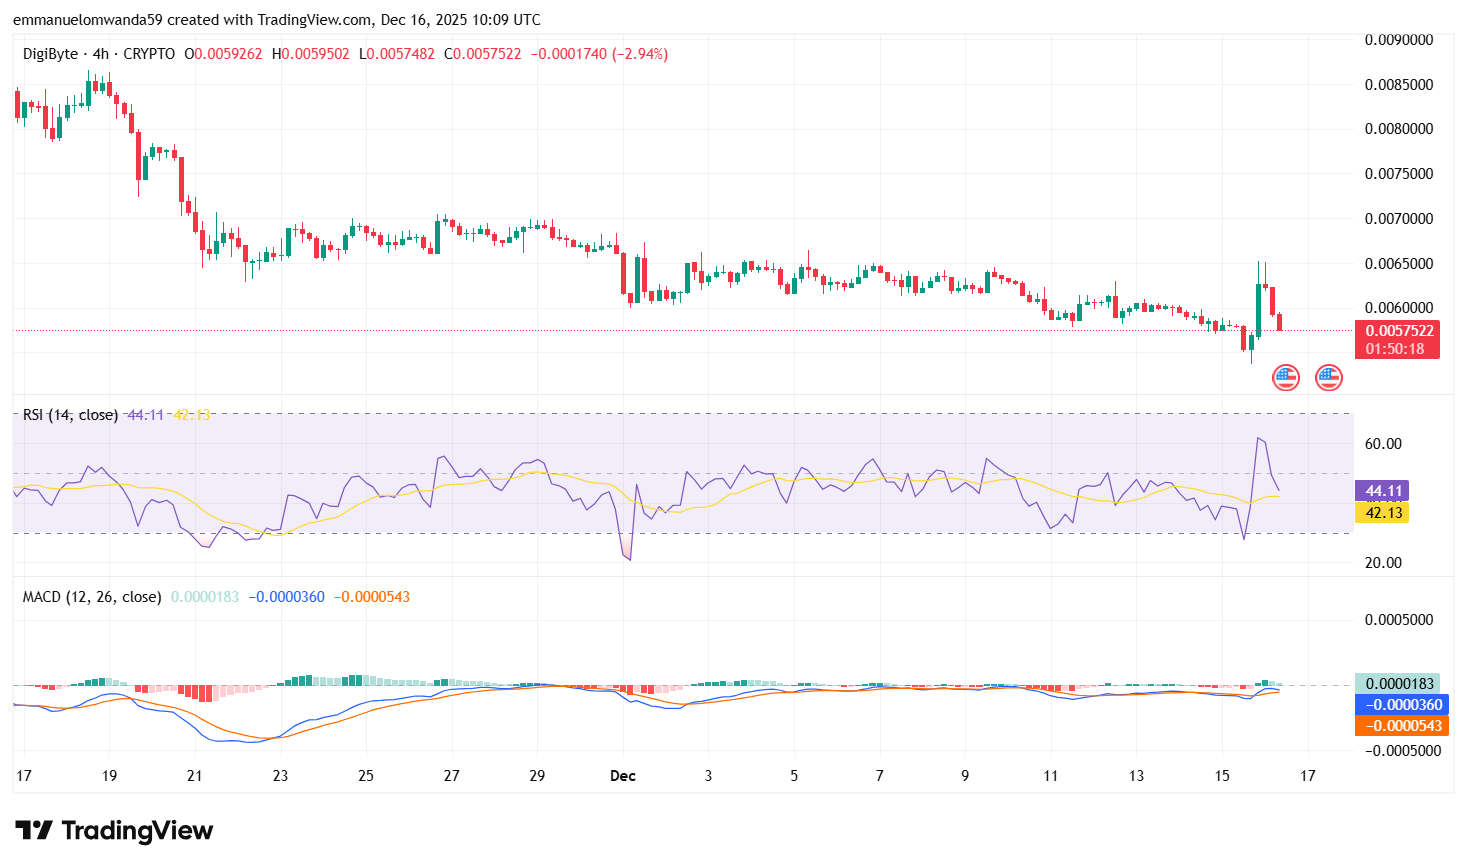 DGB/USDT Chart: TradingView
The Moving Average Convergence Divergence (MACD) continues to signal weakness. The MACD line stands at -0.000360, below the signal line at -0.000543, while the histogram shows marginal improvement. Despite this slight easing in bearish pressure, the lack of a bullish crossover indicates that selling momentum still outweighs buying interest.
DigiByte Technical Indicators: Levels And Action
Daily Simple Moving Average (SMA)
| Period | Value ($) | Action |
| SMA 3 | $0.006805 | SELL |
| SMA 5 | $0.006643 | SELL |
| SMA 10 | $0.006471 | SELL |
| SMA 21 | $0.006495 | SELL |
| SMA 50 | $0.007323 | SELL |
| SMA 100 | $0.007466 | SELL |
| SMA 200 | $0.008097 | SELL |
Daily Exponential Moving Average (EMA)
| Period | Value ($) | Action |
| EMA 3 | $ 0.006616 | SELL |
| EMA 5 | $ 0.006923 | SELL |
| EMA 10 | $ 0.007344 | SELL |
| EMA 21 | $ 0.007831 | SELL |
| EMA 50 | $ 0.008288 | SELL |
| EMA 100 | $ 0.008575 | SELL |
| EMA 200 | $ 0.008908 | SELL |
What to expect from the DigiByte price analysis next?
DigiByte is likely to remain in a consolidation phase as long as the price holds above the $0.00575 support level. A shift in momentum would be signaled by strengthening buying pressure and improving technical indicators. A sustained move above the $0.00600 resistance could support a short-term recovery, while a drop below support may trigger further downside.
Is DigiByte a good investment?
DigiByte offers strong long-term potential due to its secure proof-of-work blockchain and fast 15-second block times. Transactions are confirmed in just 1.5 minutes, making it practical for everyday use. Its active community and committed developers continue to drive innovation. These features position DigiByte as a solid choice for investors seeking real-world utility and strong technology.
Why is DigiByte up today?
DigiByte (DGB) is slightly up today in some trading sessions, driven mainly by a short-term technical rebound marked by a bullish MACD crossover and a sharp spike in trading volume. The move also reflects speculative buying as traders look for oversold altcoins amid weak broader market sentiment. However, DGB remains below key resistance levels, meaning the uptick may be a relief rally rather than a confirmed trend reversal.
Will DigiByte reach $1?
DigiByte’s price can reach $1 if positive market conditions and investor sentiment continue. But it’s highly unlikely without massive adoption
Will DigiByte reach $10?
Reaching $10 for DigiByte is highly ambitious and unlikely in the near term due to its current price levels and the significant market capitalisation required.
Does DigiByte have a good long-term future?
DigiByte has potential for a strong long-term future due to several key factors. Firstly, it boasts a robust, secure blockchain with a focus on speed and efficiency, making it one of the fastest and most decentralised blockchains in the market.
Where Can You Buy DigiByte (DGB)?
DGB is a freely tradable altcoin and is available on multiple exchanges. Trading pairs are available for cryptocurrencies, stablecoins, and fiat currencies. Bilaxy, Binance, Sistemkoin, and OKEx had the lion’s share of volume for DGB trading pairs.
Recent news/opinion on DigiByte
Recently, DigiByte has officially released DigiByte Core v8.26.1, making the latest $DGB v8.26 update live across the network. The team has urged all users, exchanges, wallets, mining pools, and node operators to upgrade promptly to ensure continued compatibility, security, and performance.
DigiByte Price Prediction December 2025
The DigiByte (DGB) price for December 2025 may reach a minimum value of $0.0057 while the maximum forecasted price is around $0.00673. The average price for DGB is predicted to reach $0.00626 in December 2025.
| DigiByte Price Prediction | Potential Low | Potential Average | Potential High |
| DigiByte Price Prediction December 2025 | $0.0057 | $0.00626 | $0.00673 |
DigiByte Price Prediction 2025
In 2025, the price of DigiByte is expected to reach a minimum price value of $0.0057. The DGB price can reach a maximum price value of $0.00673, with the average value of $0.00626.
| DigiByte Price Prediction | Potential Low | Potential Average | Potential High |
| DigiByte Price Prediction 2025 | $0.0057 | $0.00626 | $0.00673 |
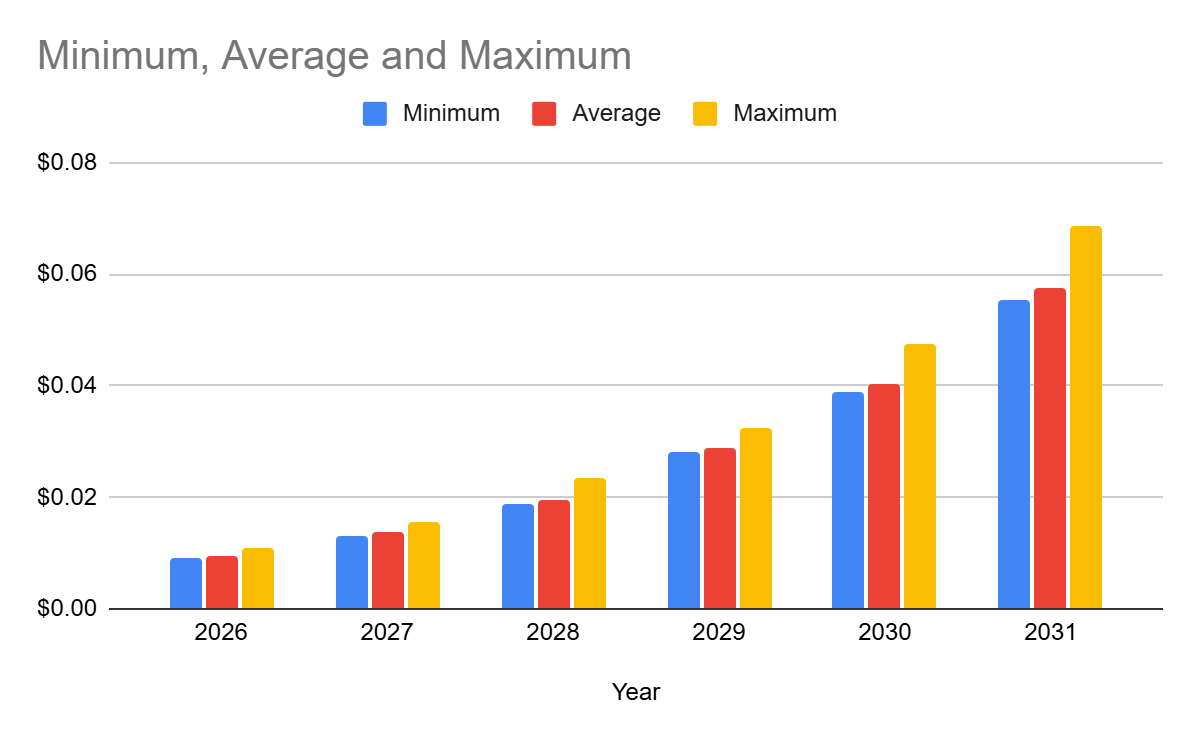
DigiByte Price Predictions 2026-2031
| Year | Minimum | Average | Maximum |
| 2026 | $0.0090829 | $0.0094099 | $0.011 |
| 2027 | $0.0132 | $0.0137 | $0.0157 |
| 2028 | $0.0189 | $0.0195 | $0.0235 |
| 2029 | $0.0281 | $0.0289 | $0.0325 |
| 2030 | $0.0389 | $0.0403 | $0.0476 |
| 2031 | $0.0555 | $0.0575 | $0.0686 |
DigiByte Price Prediction 2026
In 2026, the price of DigiByte is forecasted to be at around a minimum value of $0.0090829. The DigiByte price value can reach a maximum of $0.011 with the average trading value of $0.0094099 in USD.
DigiByte Price Prediction 2027
DigiByte price is forecast to reach a lowest possible level of $0.0132 in 2027. As per our findings, the DGB price could reach a maximum possible level of $0.0157 with the average forecast price of $0.0137.
DigiByte Price Prediction 2028
In 2028, the price of DigiByte is predicted to reach a minimum level of $0.0189. The DGB price can reach a maximum level of $0.0235, with the average trading price of $0.0195.
DigiByte Price Prediction 2029
The price of 1 DigiByte is expected to reach a minimum level of $0.0281 in 2029. The DGB price can reach a maximum level of $0.0325 with the average price of $0.0289 throughout 2029.
DigiByte Price Prediction 2030
The price of DigiByte is predicted to reach a minimum level of $0.0389 in 2030. The DigiByte price can reach a maximum level of $0.0476 with the average price of $0.0403 throughout 2030.
DigiByte Price Prediction 2031
In 2031, the price of DigiByte is predicted to reach a minimum level of $0.0555. The DGB price can reach a maximum level of $0.0686, with the average trading price of $0.0575.
 DigiByte Price Prediction 2025-2031
DigiByte market price prediction: Analysts’ DGB price forecast
| Firm Name | 2025 | 2026 |
| swapspace | $0.006 | $0.0173 |
| DigitalCoinPrice | $0.0061 | $0.0213 |
| Coincodex | $ 0.0058744 | $ 0.019647 |
Cryptopolitan’s DigiByte Price Prediction
According to Cryptopolitan, DigiByte’s all-time high is still far off. However, we expect DigiByte to start a cautious recovery. Throughout the year, the price was projected to trend upward. Will DGB manage to reach a new all-time high? In that case, the price of DGB could significantly increase.
DigiByte Historic Price Sentiment
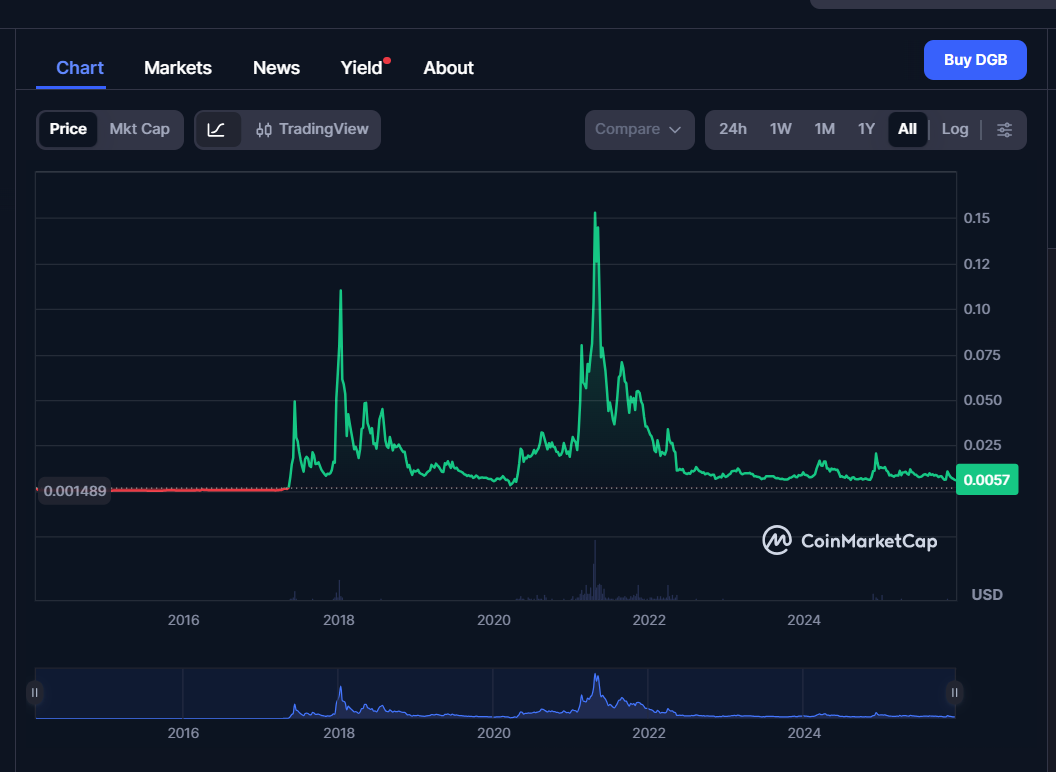 DigiByte Price History: CoinMarketCap
- DigiByte’s native token, DGB, was introduced into the market back in 2014. DigiByte price remained at $0.01 for a couple of days before dropping even further towards $0.0003.
- The altcoin did not excel during its early days, and most investors opted to acquire other, more prominent digital assets. Nevertheless, the DigiByte cryptocurrency began to grow gradually and started amassing capital.
- Digibyte (DGB) hovered within $0.0003 for about three years before spiking during the spring of 2017.
- Investors who acquired DGB early made a threefold profit when the Digibyte price reached $0.001. For once, the DigiByte cryptocurrency market cap started to spell tens of millions of dollars.
- During the fall of 2017, a well-known payment platform, Paytomat, added support for DGB. On top of that, popular crypto exchanges listed the cryptocurrency. As a result, the DGB price started growing more resolutely.
- Early in 2018, the price of DGB reached a record high of 13 cents per DGB token and $1.2 billion in total market capitalization.
- Unfortunately, the pull-back phase kicked in and drove the cryptocurrency downwards. The sharp retracement transformed into a broad bearish trend, and indicators dropped.
- Another notable pricing event occurred when the price of DGB rose from $0.017 to $0.049 in April 2018, gaining more than 185 percent.
- Afterward, its price plummeted to a low of $0.004 in 2020.
- In January 2021, one DGB traded at $0.025 after a substantial rally. At the time of writing, one DigiByte token retails at $0.043.
- In October 2021, the price increased again to roughly $0.07.
- In Jan 2022, DigiByte’s price was around $0.05, and then the price peaked again at approximately $0.125 in April of the same year.
- In the year 2023, the price was around $0.02 in January and ranged between $0.1 to $0.02 for the rest of the year.
- DigiByte faced a slight increase to about $0.022 in January. Between June and July 2024, the price stabilized at around $0.0076.
- In the following months, the price of DigiByte dropped sharply as it fell to a low below $0.006 in November.
- DGB price continued to consolidate below $0.009 in early 2025.
- As of June 2025, DigiByte traded at $0.00814, reflecting a modest rebound from its mid-2024 stabilization around $0.0076.
- From July through December 2025, DigiByte remained range-bound, gradually easing from the June level of around $0.0081 to trade near $0.0057 most recently.


 English (US)