
 1 hour ago
970
1 hour ago
970

Key takeaways
- By 2026, the CTSI price could reach a maximum of $0.0486.
- In 2029, the price of Cartesi is predicted to reach a maximum level of $0.0832.
- Cartesi is expected to cross a price level of $0.287 in 2032.
Cartesi is a blockchain project that allows developers to build decentralized applications (dApps) and smart contracts using traditional programming tools like Python and MySQL. Its Cartesi Machine runs off-chain computations, enhancing scalability and efficiency. After reaching an all-time high of $1.75 in May 2021, the price has since dropped to $0.02–$0.03. Predictions for 2026 show modest growth, while some forecasts hint at potentially larger gains.
Overview
| Cryptocurrency | Cartesi |
| Token | CTSI |
| Price | $0.0239 |
| Market Cap | $24.08M |
| Trading Volume | $2.7M |
| Circulating Supply | 904.55M CTSI |
| All-time High | $1.75 May 08, 2021 |
| All-time Low | $0.02403 May 09, 2020 |
| 24-h High | $0.02474 |
| 24-h Low | $0.0232 |
Cartesi price prediction: Technical analysis
| Metric | Value |
| Price Prediction | $0.0214 (-9%) |
| Volatility | 10.09% (Very High) |
| 50-Day SMA | $ 0.03214 |
| 14-Day RSI | 42.78 (Neutral) |
| Sentiment | Bearish |
| Fear & Greed Index | 8 (Extreme Fear) |
| Green Days | 13/30 (43%) |
| 200-Day SMA | $ 0.04951 |
Cartesi price analysis: CTSI consolidates in a narrow range amid a mild downtrend
- CTSI is consolidating in a narrow range, showing low directional momentum and limited price movement.
- Intraday recoveries have been short-lived, with momentum fading after brief gains.
- Traders remain cautious, waiting for a decisive breakout or catalyst to establish the next trend.
On March 3, 2026, Cartesi CTSI trades at $0.0239, reflecting a 0.39% decline on the day. The token remains under mild pressure as intraday volatility keeps price action confined within a narrow range between $0.02344 support and $0.02474 resistance.
Cartesi daily price chart: CTSI consolidates in a tight range
On the daily timeframe, CTSI shows structural compression between horizontal boundaries, reflecting reduced directional momentum. Price tested support early in the session before rebounding toward resistance, forming a long lower wick that signals buying interest near key levels.
 CTSI/USDT Chart: TradingView
Cartesi (CTSI) continues to consolidate in a narrow range, showing low directional momentum. The RSI hovers near 40, indicating mild bearish pressure without extreme oversold conditions. MACD remains flat, reflecting sideways price action. Traders are waiting for a decisive move to signal the next trend.
Cartesi 4-hour price chart: CTSI shows intraday recovery amid fading momentum
On the 4-hour chart, price action demonstrates a sharp intraday recovery followed by sideways consolidation. Momentum is fading, with lower highs indicating short-term distribution. Repeated defense of support highlights active buying, but traders remain cautious, awaiting a catalyst.
 CTSI/USDT Chart: TradingView
The RSI is near 46, signaling neutral momentum with no strong overbought or oversold conditions. This indicates the recent bounce may struggle to continue without a new catalyst, as momentum appears to be fading and traders await a clear directional signal.
Cartesi technical indicators: Levels and action
Daily simple moving average (SMA)
| Period | Value | Action |
| SMA 3 | $ 0.03039 | SELL |
| SMA 5 | $ 0.02875 | SELL |
| SMA 10 | $ 0.02701 | SELL |
| SMA 21 | $ 0.02758 | SELL |
| SMA 50 | $ 0.03214 | SELL |
| SMA 100 | $ 0.03611 | SELL |
| SMA 200 | $ 0.04951 | SELL |
Daily exponential moving average (EMA)
| Period | Value | Action |
| EMA 3 | $ 0.02923 | SELL |
| EMA 5 | $ 0.03077 | SELL |
| EMA 10 | $ 0.03228 | SELL |
| EMA 21 | $ 0.03336 | SELL |
| EMA 50 | $ 0.03697 | SELL |
| EMA 100 | $ 0.04436 | SELL |
| EMA 200 | $ 0.05631 | SELL |
What to expect from Cartesi?
CTSI is likely to continue trading in a narrow range until a clear catalyst emerges. Short-term recoveries may struggle to gain traction as momentum remains weak, and traders are expected to stay cautious. A decisive breakout above resistance or a breakdown below support will likely signal the next meaningful trend.
Why Is Cartesi( CTSI) Down Today?
CTSI is down due to mild selling pressure and low directional momentum, keeping price action confined within a tight range. Intraday volatility has been limited, and short-term recoveries are struggling to sustain gains. Traders remain cautious, awaiting a clear catalyst or breakout to drive the next meaningful move.
Is Cartesi a good investment?
CTSI is currently consolidating in a narrow range with weak momentum, making it more suitable for cautious traders rather than aggressive investors. Short-term gains may be limited until a clear breakout or catalyst drives price direction. Investors should watch for a decisive move above resistance or below support before considering a position, as the token’s next significant trend is still uncertain.
Recent news
Cartesi positioned February as a delivery-driven month for developers building high-throughput Web3 applications. The platform highlighted its Linux-based infrastructure with Ethereum settlement, allowing builders to deploy arbitrary code with embedded security guarantees.
Will Cartesi reach $0.05?
According to the Cryptopolitan price prediction, Cartesi is expected to cross the $0.05 mark in 2027, when it will reach a average price of $0.0510.
Will Cartesi reach $0.1?
Based on long-term forecasts, Cartesi is projected to reach $0.1 by 2031, potentially increasing its market capitalization as its ecosystem and user adoption continue to grow.
Does CTSI have a good long-term future?
While Cartesi faces challenges, its unique combination of traditional programming tools and blockchain scalability offers potential. Its future growth will depend on successful developments within the project, investor sentiment, and broader market trends.
Cartesi price prediction for March 2026
The expected price of Cartesi (CTSI) for March 2026 is forecasted to range from a minimum of $0.023 to a maximum of $0.02725, with an average price of $0.02587.
| month | Potential Low | Potential Average | Potential High |
| March 2026 | $0.023 | $0.02587 | $0.02725 |
Cartesi price prediction 2026
The Cartesi (CTSI) price is forecasted to reach a low of $0.022 in 2026, with a maximum potential price of $0.0486 and an average forecast price of $0.0450.
| year | Potential Low | Potential Average | Potential High |
| 2026 | $ 0.022 | $ 0.0450 | $0.0486 |
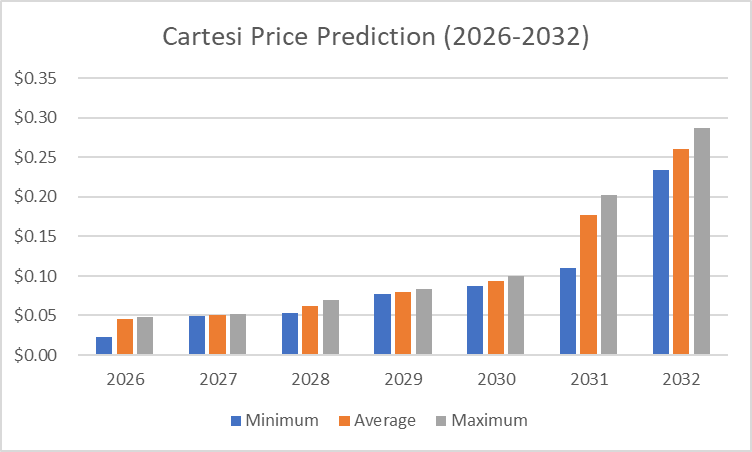
Cartesi Price Prediction 2027-2032
| Year | Minimum | Average | Maximum |
| 2027 | $0.0495 | $0.0510 | $0.0524 |
| 2028 | $0.0531 | $0.0619 | $0.0692 |
| 2029 | $0.0772 | $0.0802 | $0.0832 |
| 2030 | $0.0874 | $0.0941 | $0.0996 |
| 2031 | $0.11 | $0.177 | $0.203 |
| 2032 | $0.234 | $0.261 | $0.287 |
Cartesi price prediction 2027
The Cartesi (CTSI) price is forecasted to reach a low of $0.0495 in 2027, with a maximum potential price of $0.0524 and an average forecast price of $0.0510.
Cartesi price prediction 2028
The Cartesi (CTSI) price prediction is to reach a low of $0.0531 in 2028, with a maximum potential price of $0.0692 and an average forecast price of $0.0619.
Cartesi price prediction 2029
The Cartesi (CTSI) price prediction climbs even higher into 2029. According to the prediction, CTSI’s price will range between $0.0772 and $0.0832, with an average price of $0.0802.
Cartesi Coin price prediction 2030
The Cartesi (CTSI) price is forecasted to reach a low of $0.0874 in 2030, with a maximum potential price of $0.0996 and an average forecast price of $0.0941.
Cartesi Coin price prediction 2031
The Cartesi price prediction for 2031 indicates an expected price range of $0.11 and $0.203, with an average of $0.177.
Cartesi Coin price prediction 2032
The Cartesi (CTSI) price is forecasted to reach a low of $0.234 in 2032, with a maximum potential price of $0.287 and an average forecast price of $0.261.
 CTSI price prediction 2026-2032
Cartesi market price prediction: Analysts’ CTSI price forecast
| Firm Name | 2026 | 2027 |
| DigitalCoinPrice | $0.0271 | $0.0321 |
| CoinCodex | $ 0.0268 | $0.0226 |
Cartesi price prediction by Cryptopolitan
According to Cryptopolitan, CTSI will experience tremendous growth as it can achieve new highs in price points and market cap. Meanwhile, Cartesi is expected to reach a minimum price of $0.02. The maximum price may reach $0.0486 in 2026.
Cartesi (CTSI) historic price sentiment
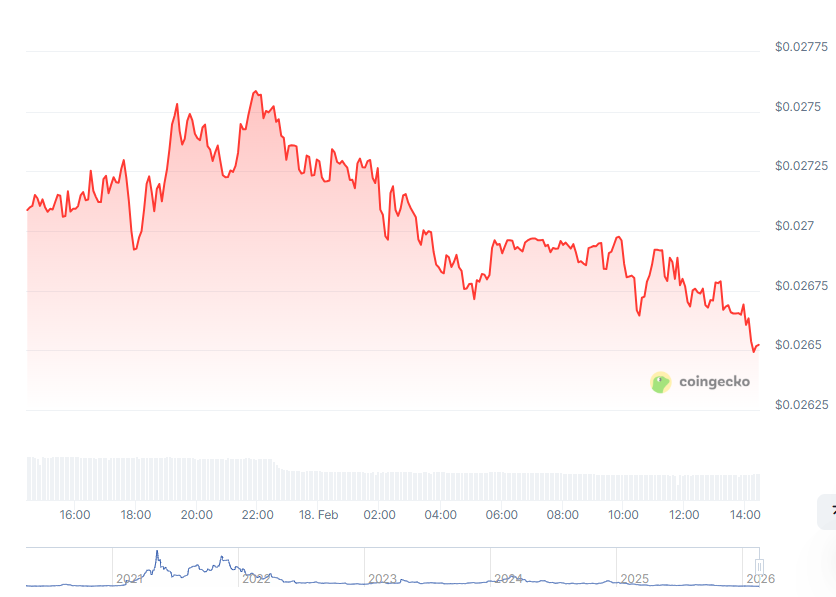
Cartesi price history: coingecko
- In April 2020, Cartesi’s public trading kicked off with an opening price of $0.05717. The price fell to $0.02675 in May 2020, an all-time low.
- Towards the end of May 2020, the CTSI price rose above the $0.03 mark and traded within $0.03 – $0.04 until June 2020.
- On August 18, 2020, Cartesi’s price reached a year-high market price of $0.1298, but the momentum fizzled out, and the price dropped to $0.02683 on October 30.
- Before the turn of 2021, CTSI made some recoveries, and its price jumped as high as $0.06217 in December 2020.
- The positive momentum continued in January 2021, and its market price surged to an all-time high of $1.75 on May 09, 2021.
- Afterwards, the price of CTSI fell and then jumped to $1.25 on August 9, 2021. Currently, Cartesi is trading at $0.625, with a market cap of over $260 million and a 24-hour trading volume of over $31 million.
- In January 2022, the price decreased to around $0.50, indicating a market correction or a period of reduced trading activity.
- The price stabilized around $0.20 in July 2022, suggesting a period of consolidation where buying and selling pressures were balanced.
- In October 2023, the price remained stable at around $0.15, indicating another period of consolidation.
- In 2024, the cryptocurrency price ranged between $0.14 and $0.20. It rose to $0.20 in January, dropped to $0.14 by April, and remained stable mid-year. From August to October, it fluctuated narrowly between $0.15 and $0.20, with slight upward momentum in December, briefly exceeding $0.20.
- In January 2025, the price settled around $0.15 as the most recent value, indicating either market corrections or consistent demand levels.
- In February 2025, Cartesi traded around $0.13 to $0.11, gradually declining through March to approximately $0.10.
- By April, the price dipped further to about $0.085, continuing a slow descent throughout May, where it hovered between $0.08 and $0.075.
- In June, Cartesi’s price dropped closer to $0.07, and by July 2025, it stabilized at around $0.074.
- In August 2025, it traded around $0.033, then fell to $0.031 in September, $0.030 in October, and $0.029 in November.
- As of December 2025, the downtrend continued with $0.028.
- In January 2026, Cartesi (CTSI) hovered around $0.03 and trended slightly downward, and by February 2026 it extended its decline to approximately $0.026 amid continued weak momentum.


 English (US)