
 3 hours ago
933
3 hours ago
933


The post Bitcoin Price Mirrors 2021 Structure as 30-Month Cycle Points to 2028 appeared first on Coinpedia Fintech News
The Bitcoin price is hovering in a range of $60K to $70K and quietly sketching a structure that feels eerily familiar. If this is a bullish divergence phase like the one after the 2021 crash, then the current Bitcoin price prediction might frustrate impatient bulls more than outright bears ever did.
First Top Shock Repeats
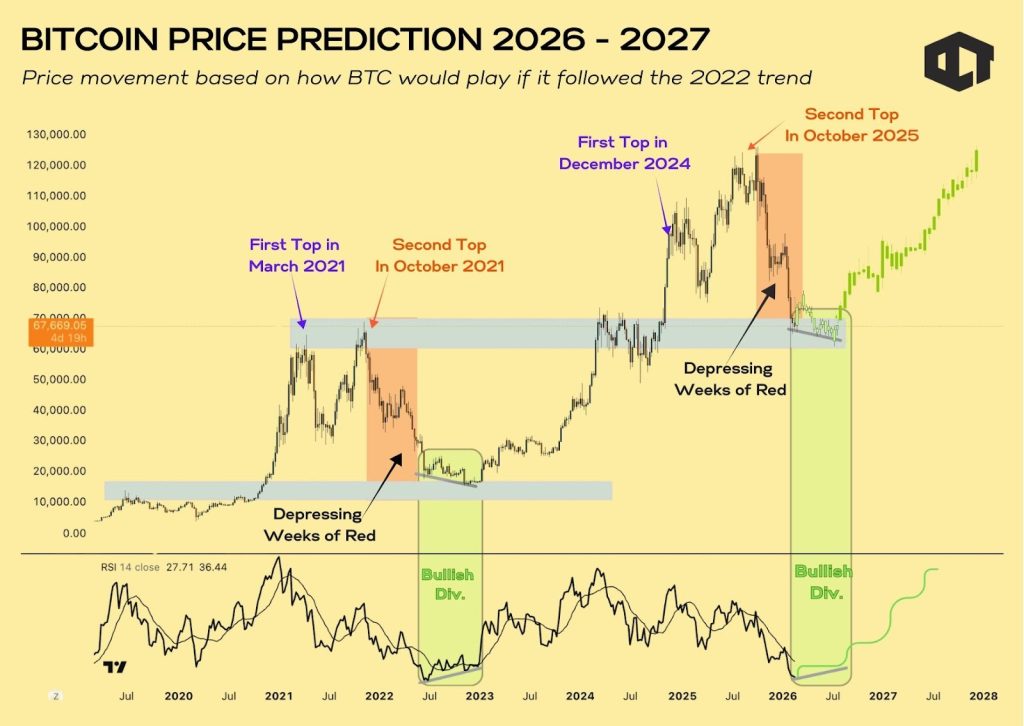
Based on an analyst theory, March 2021 gave us the first major top. Because at this time, the momentum overheated. Retail was euphoric. RSI stretched thin. Then the sharp correction arrived.
Fast forward to December 2024, First time the 2021 Ath was flipped. This became the first top of this cycle, after 2021 crash.
Then second top came in October 2025 when 126K was reached. Now in 2026, the structure is uncomfortably similar.
Markets cool off after vertical expansion. That’s not drama, it’s mechanics and how BTC price action has been. The level it holds points to two main theories, first failure to hold $60K and market crashes more and second it repeats what it did afterwards 2022.
Therefore, if price avoids slipping under $60K while forming a bullish RSI divergence, it would resemble the 2022 reset phase that followed the 2021 crash. Not identical. But close enough to raise eyebrows.
Second Peak, Weaker Momentum
Lets have a look at follow up momentum after each primary bullish rallies. In march 2021 the primary rally marked first top and October 2021 showed a follow up momentum that delivered the second top. It looked strong. It felt bullish.
But momentum was already weaker than the first peak. Then came those slow, grinding weeks of red candles.
Now if we look at October 2025. Then its second top again and like previous history the next RSI divergence seems like an option.
Since, history doesn’t replay perfectly. Still, it tends to rhyme and this one feels almost scripted only if $60K isn’t lost.
The Boring Base Phase
Similar to 2022 exhaustion phase where momentum was range bound which is often called boring phase.
Now this phase in 2026 seems like a possibility. As weekly RSI is hovering near zones that previously marked exhaustion again.
But this is boring phase that tests investors patience and filters out weak hands. So it isnt this easy to look at fireworks in BTC price.
This is the part nobody enjoys. Compression. Sideways drift. Narrative fatigue. But structurally, this is where long-term cycles tend to rebuild.
Well, here’s the kicker. The previous peak-to-new-ATH cycle took roughly 30 months. From the 2021 top to the 2024 breakout, so the key player here was time, not hype ans neither was the catalyst.
If the same rhythm applies from the October 2025 second top, then that stretches meaningful expansion toward 2027–2028 and most of the 2026 could pass in compression.
Even the projected $120K to $130K zone wouldn’t arrive tomorrow. It would arrive late, if we look at history.
So, what’s next? If history’s cadence holds, the Bitcoin price may simply be grinding through its “base-building” chapter. No collapse. No instant moonshot. Just time doing what it has always done to Bitcoin/USD compress first, expand later.
And if this cycle truly isn’t different, then the real Bitcoin price analysis suggests breakout might be delayed, not denied.


 English (US)