
 1 month ago
6722
1 month ago
6722

As Bitcoin (BTC) struggles to hold above the $95,000 support zone, the cryptocurrency appears primed for deeper losses toward the $80,000 region.
According to analysis by Ali Martinez, Bitcoin has broken below a key ascending channel, a structure that had supported price action throughout previous months.
The breakdown is significant because it signals a shift in momentum from consolidation to a more pronounced bearish trend.
In an X post on November 16, the analyst noted that this move “opens the door to a drop toward $83,500,” marking one of the most bearish near-term projections since the recent market correction began.
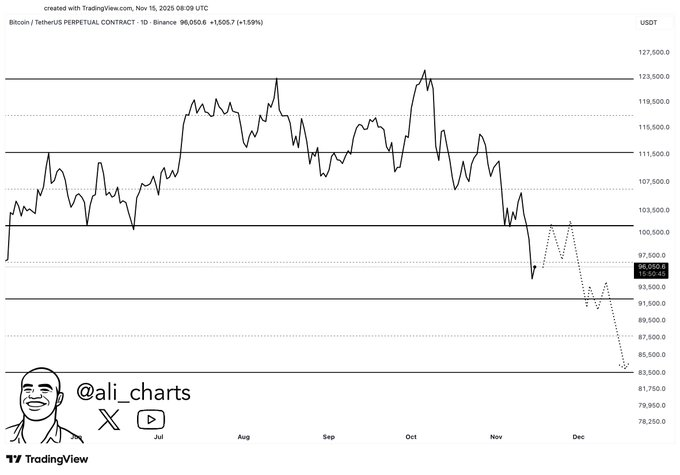 Bitcoin price analysis chart. Source: TradingView
After failing to reclaim the $100,500 support zone, Bitcoin continued forming lower highs and lower lows, pointing to a weakening market structure. The analysis outlined a likely brief consolidation between $95,000 and $97,000 before the downtrend resumes.
At the same time, the projection highlighted two stages: an initial retest of the mid-$90,000 area, followed by a deeper slide through support levels at $91,500, $89,000, and $86,500. If these levels fail, a move toward $83,000 becomes increasingly likely.
Bitcoin hits Extreme Fear
Notably, the bearish outlook comes as the crypto market remains deep in risk-off territory, with the Bitcoin Fear & Greed Index plunging to 10 firmly in Extreme Fear. The reading has held steady, highlighting a month-long deterioration in sentiment; just a week ago, the index sat at 22 and already signaled heightened caution.
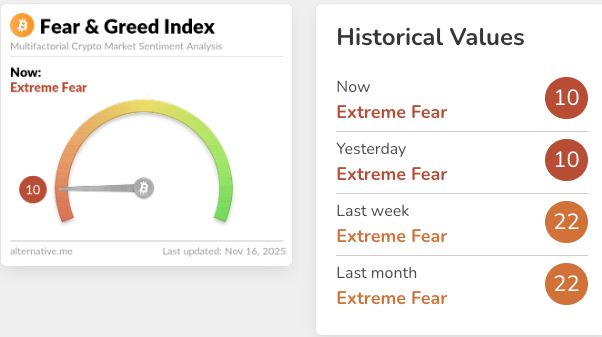 Crypto Fear & Greed Index. Source: Alternative.me
This prolonged slump suggests traders are increasingly anxious amid volatility and broader economic uncertainty. Extreme fear reflects intensified selling pressure and a retreat by many market participants. Historically, similar lows have often aligned with market bottoms as panic peaks and weaker hands exit.
For prices, this environment points to a market nearing a psychological breaking point. While extreme fear may fuel further short-term weakness as traders avoid new positions, such sentiment troughs have also marked moments when long-term investors begin accumulating assets viewed as undervalued.
Though sentiment alone doesn’t dictate price action, a reading this low highlights an emotionally stretched market that may be poised for a significant shift once confidence returns.
Bitcoin price analysis
By press time, Bitcoin was trading at $95,973, having gained a modest 0.13% in the past 24 hours, while on the weekly timeline the asset has plunged about 6%.
 Bitcoin seven-day price chart. Source: Finbold
At the current price, Bitcoin sits well below its 50-day SMA of $111,417 and 200-day SMA of $105,695, placing it firmly beneath major trend indicators and reinforcing a clear bearish posture. Such a wide gap between spot price and these moving averages typically signals fading momentum and a market struggling to regain upward direction.
The 14-day RSI at 31.23 adds further context. While not yet oversold, it is hovering just above that level, indicating sellers have dominated but that downside pressure may be nearing exhaustion.
Featured image via Shutterstock
The post Bitcoin flashes more crash signals as path to $83,000 emerges appeared first on Finbold.


 English (US)