

- ChainLink’s upward trend against Bitcoin highlights its strong market position and potential for continued growth in the crypto space.
- Analyst Michaël van de Poppe emphasizes ChainLink’s resilience and status as a leading asset, demonstrating notable strength against Bitcoin.
- Chainlink displays resilience, recovering from a downturn to stabilize around $13.88 despite a slight 0.50% decline over the past 24 hours.
Chainlink is currently experiencing a significant upward trend against Bitcoin, showcasing its strength as one of the leading assets in the cryptocurrency market. According to crypto analyst Michaël van de Poppe, this performance positions Chainlink as a strong contender in the market.
The analysis reveals that LINK is trending upward, making it one of the first movers in the crypto space. This trend indicates a positive outlook for Chainlink, suggesting potential growth and stability in the market.
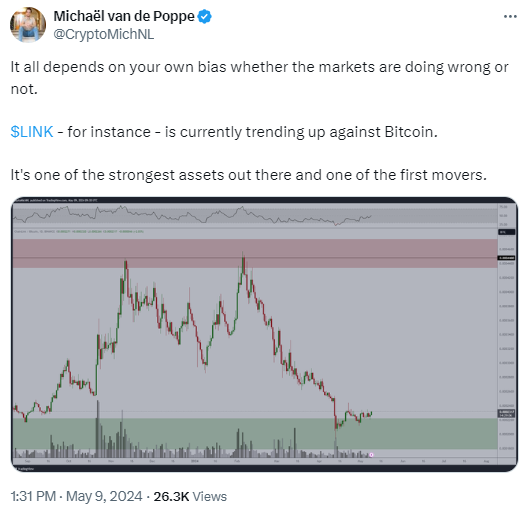
According to the chart analysis, Van de Poppe highlights LINK’s upward trajectory against Bitcoin, marking a noteworthy movement in the crypto market. This trend underscores Chainlink’s resilience and strength, distinguishing it as a robust asset among its peers. Van de Poppe emphasizes that the market’s behavior aligns with Chainlink’s strong performance, reinforcing its position in the market.
Additionally, Chainlink’s ability to maintain its upward momentum despite market fluctuations is significant. This trend indicates Chainlink’s potential for sustained growth and stability. Given its current performance against Bitcoin, the analysis suggests that investors may find Chainlink to be a promising asset.
Looking at Chainlink’s current market dynamics, LINK is showing signs of recovery following the recent downtrend. LINK dropped from the $15 level to seek support at the $13.75 region, where it is currently trading around with a value of $13.88, recording a decline of 0.50% in the past 24 hours.
Over the past week, LINK has gained over 3%, while the monthly chart displays a 20% decrease following the sharp market correction on April 14. The market capitalization is on the decline, too, with a value of $8.1 billion amid the rise in the trading volume, which currently stands at $306 million.
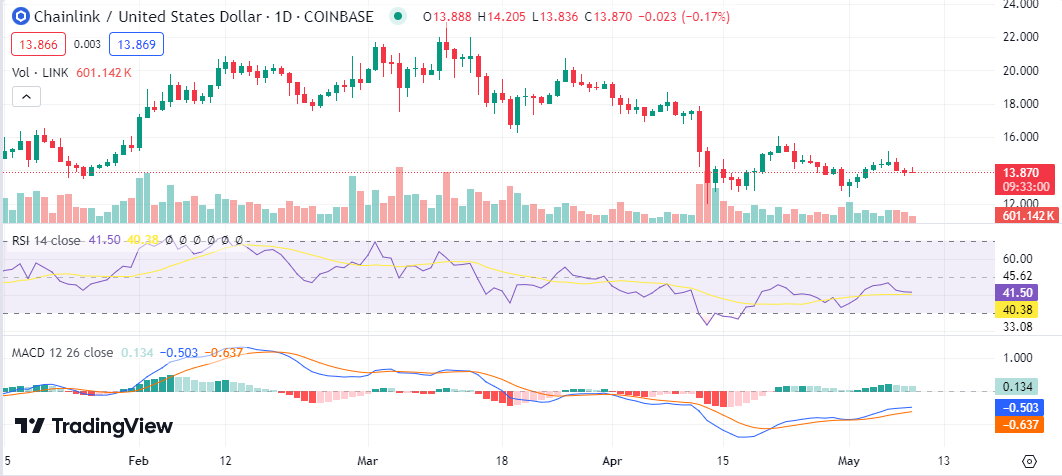 LINK/USD chart: TradingView
Technical indicators show a neutral trend. The Relative Strength Index (RSI) is hovering around the 40 index region, indicating a neutral market trend. An increase in buying pressure could send the RSI toward the overbought region, elevating the price high. However, the Moving Average Convergence Divergence (MACD) indicator is trending in the positive region, as the green bars rule the chart and the MACD line hovers above the signal line.


 English (US)