
 7 hours ago
760
7 hours ago
760

XRP is showing growing signs of weakness from a technical perspective, even as whales moved $251.8 million of the asset.
Notably, the cryptocurrency is currently settling around the $2.50 level after experiencing significant short-term capital outflows.
Now, an outlook by prominent cryptocurrency analyst Ali Martinez suggests that XRP could find support at $2. In an X post on October 31, Martinez noted that XRP’s daily chart has formed a descending pattern, characterized by lower highs and lower lows, indicating a continuation of the downtrend.
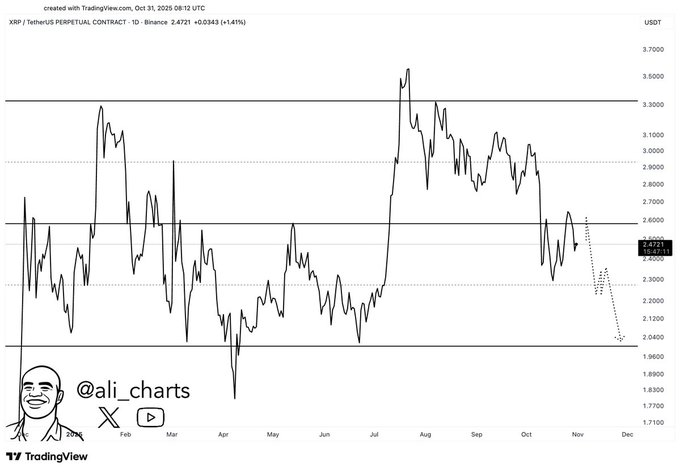 XRP price analysis chart. Source: Tradingview
His outlook shows XRP slipping below mid-range resistance near $2.60, confirming a breakdown from a bearish continuation setup. If momentum persists, the asset could follow the projected path toward the $2 support, with a potential extension toward $1.90 if that level fails to hold.
This concerning technical outlook comes as whales have executed significant transactions over the past 24 hours. On-chain data tracked by Whale Alert flagged several moves.
For instance, 74.5 million XRP (worth about $189.3 million) was transferred between two unknown wallets, while 20.9 million XRP ($52.4 million) moved to Coinbase, potentially signaling an intent to sell.
Meanwhile, 4 million XRP (valued at $10.1 million) was locked in escrow at an unknown wallet, offering a minor counterbalance to the bearish flows.
XRP price analysis
By press time, XRP was trading at $2.50, up 0.5% in the past 24 hours, while the weekly performance shows a 3.5% decline.
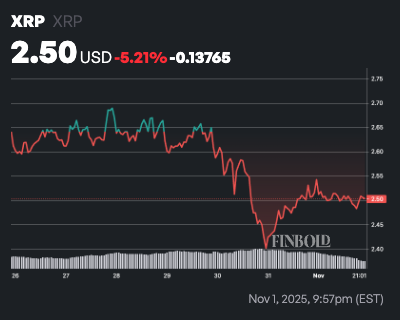 XRP seven-day price chart. Source: Finbold
At the current price, XRP’s 50-day simple moving average (SMA) stands at $2.75, placing the spot price 8.4% below this short-term trendline, a bearish signal indicating weakened momentum and potential for further downside if support fails.
The 200-day SMA, at $2.64, offers a nearer floor just 4.4% beneath the current price, hinting at mild long-term resilience but underscoring XRP’s struggle to reclaim its mid-term uptrend.
Complementing this, the 14-day Relative Strength Index (RSI) registers at 46, firmly in neutral territory. This balanced reading tempers immediate reversal risks but aligns with the SMAs’ cautionary tilt, implying consolidation rather than a breakout.
Traders may watch for RSI dips below 40 for deeper pullbacks toward the 200-day SMA or climbs above 50 for renewed tests of the 50-day level.
Featured image via Shutterstock
The post XRP under threat of crashing to $2 as whales move over $250 million appeared first on Finbold.


 English (US)